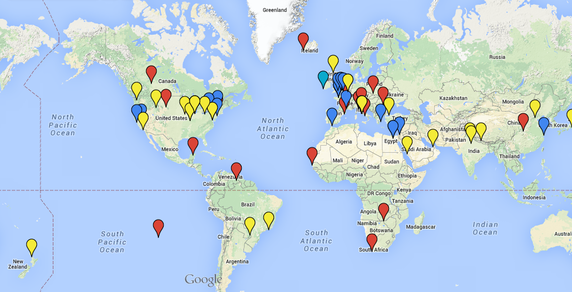
 We recently completed a research project with all three fifth grade classes at my school. During this project, students got to pick a landmark to research. After picking a landmark, they used a template to begin filling out information. The template was laid out in a specific grid to match a Pic Monkey Collage we used later in this process. Once students had recorded all their information in the grid, they were then required to find an image for each cell in the grid that best represented the information in that cell. Students used Pic Monkey to create a collage of their images they had found for each cell in their grid. This picture collage was uploaded into Thinglink to begin adding "tags" to their collage. Each photo of their collage had a "tag" added to it with the corresponding information from the cell on their grid template. After all the "tags" had been added, students then copied their Thinglink URL, opened up a shared map, searched for their landmark and added their landmark to the Google Map. They were then able to add their Thinglink URL to their landmark location. To conclude, each student was recorded giving his/her speech about their landmark. This speech was uploaded to YouTube. The URL for their YouTube speech was copied by students and added on the Google Map to their landmark. The final result was a single Google Map with a landmark represented for each student's research. Each landmark had a Thinglink URL and a YouTube URL. Below are more detailed steps of the process for this project. Landmarks We used this website for students to choose their landmarks. Students started by exploring the list of 100 landmarks. They chose their top five landmarks. We then went one by one and had students select a landmark. We did this so we would not have duplicates of the same landmark. They were allowed to search the internet to answer the questions on the Landmark Research Template. They did use TripAdvisor to determine the landmark's rating as well as the average price of activities to do at the landmark. Pic Monkey I created a Symbaloo Mix for students to use when searching for images that they had rights to use in their project. However, we still had some students that didn't filter Google or Bing results based on license. When they published their ThingLink, it would not display because of using copyrighted images. It was a good lesson for students to see why we stressed using pictures that they had permission to use. 1) After pictures were found, students went to PicMonkey. They clicked on collage to build their collage. 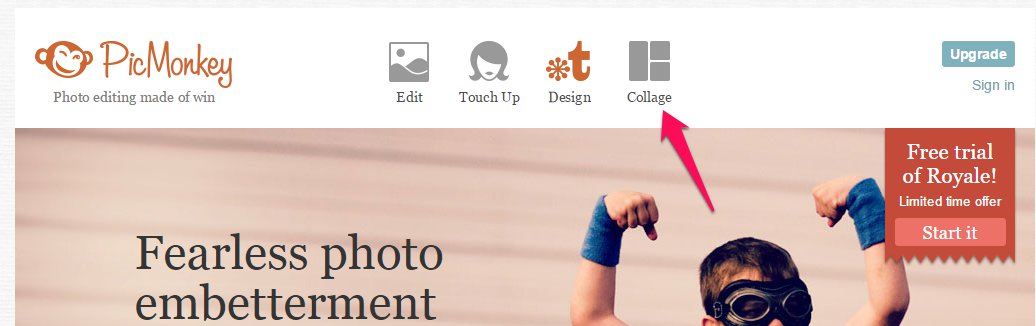 2) After adding the images from their computers, they had to change the layout of the collage. To do this, they had to click the layout icon like the picture below. 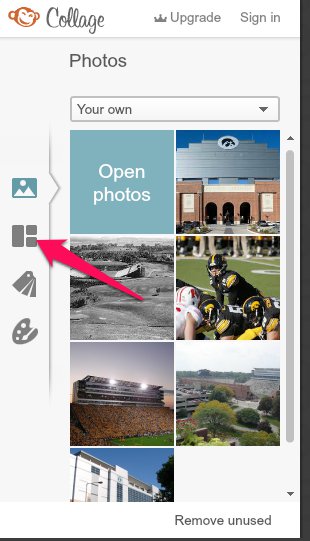 3) After selecting the layout option, they clicked "cards," changed the layout to 6 x 8 and then chose the last option to the right like the image below. *This layout was chosen because it matched out Landmark Research template that students had used to record their information. This was set up this way to assist with easily adding "tags" during the Thinglink step. 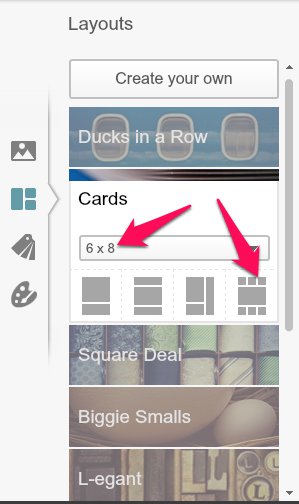 4) After changing to the correct layout, they just had to drag and drop their images into the correct cell of the grid. Once done adding images, they clicked save at the top. 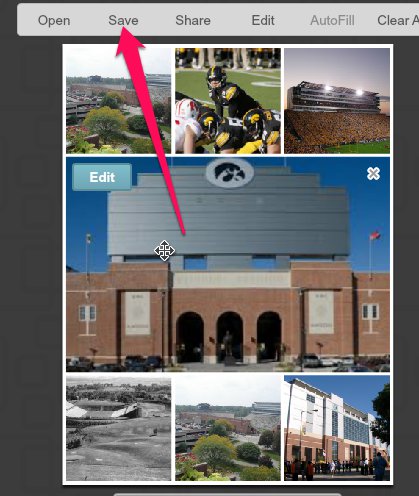 5) After clicking save, they are given the option to rename their image and specify the save location. We saved all our images to Google Drive during this project. 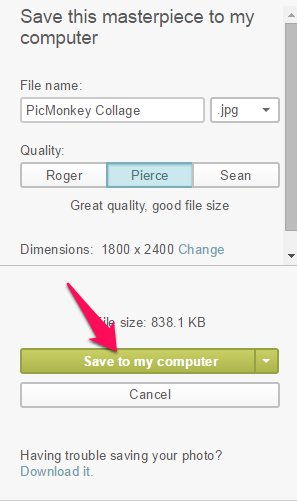 Thinglink Prior to this project, I had purchased a license to Thinglink. It was $35, but provided some nice features for using it with 75ish 5th graders. 1) The first thing students did after logging into their account was click create. 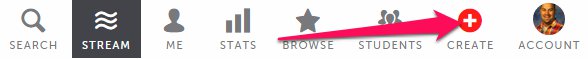 2) Next students had to click the big blue button to be able to select their pic collage they had made using PicMonkey. 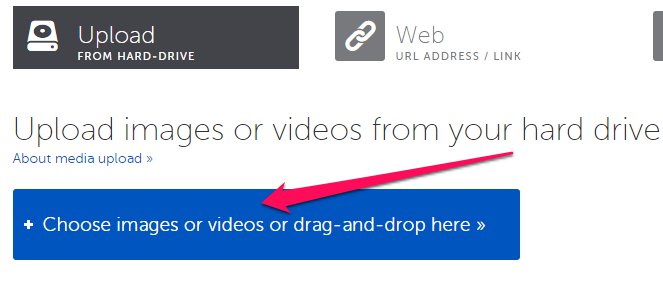 3) After their image was loaded, they were able to rename their Thinglink image and begin adding tags. 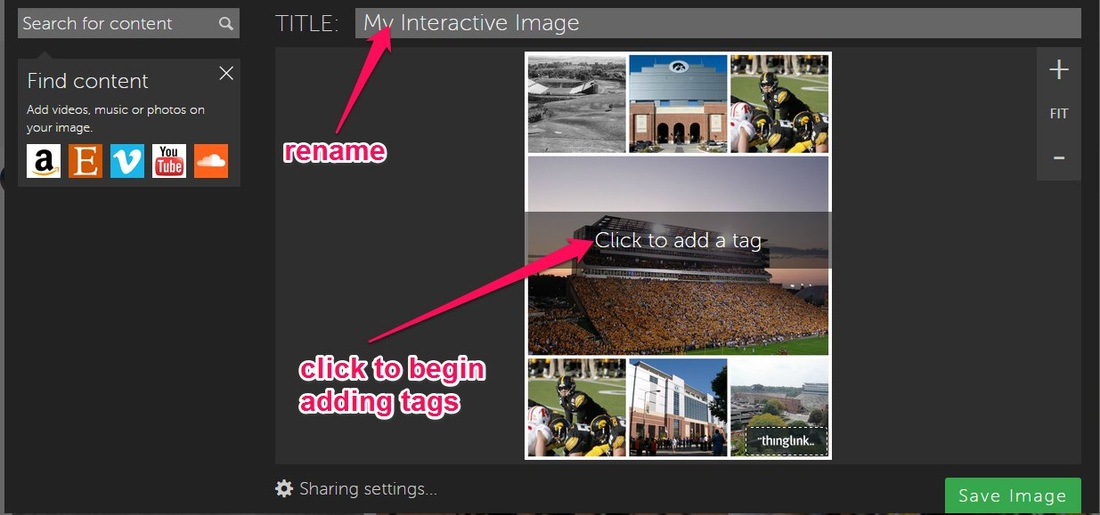 4) When adding a tag, they had the option to put in a URL or they could simply type in text that would be visible when the tag was hovered over by the mouse. We had students type in text. The text was the information they had recorded from their Landmark Research template. 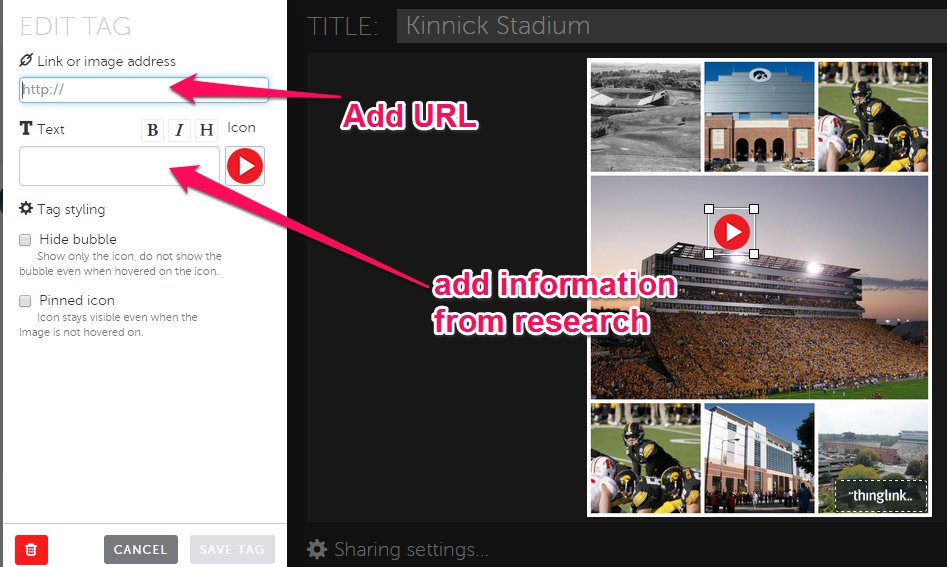 5) After adding all their tags, students were able to save their Thinglink image by clicking the green save button. 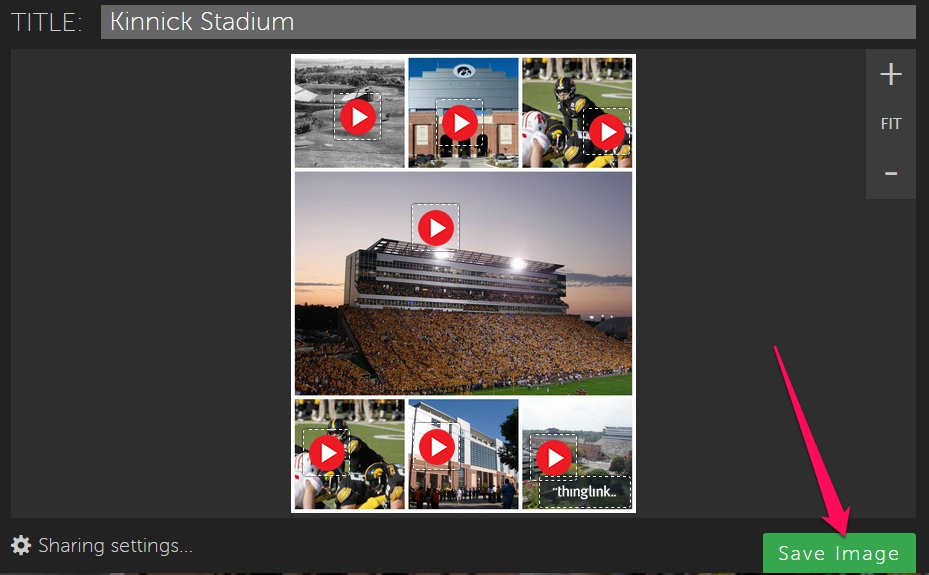 6) After saving their Thinglink image, they were able to click the share button. This provided them with multiple options for sharing. We chose to have students copy the URL to add to our shared Google Map. 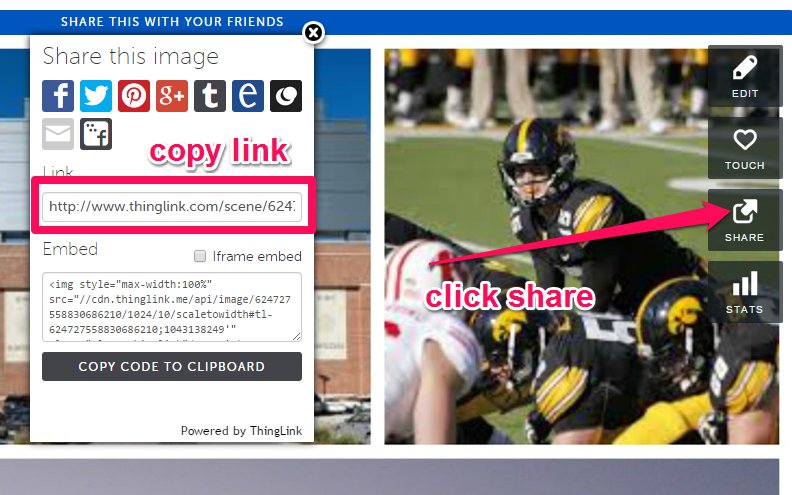 Google Maps Prior to students adding their links to a shared Google Map, I had to set up some of the basics of the map. 1) I first had to go to maps.google.com and click in the search bar. Make sure you are signed into Google which should give you the option for "my maps." After clicking my maps, you should have the option to "create" a new map. 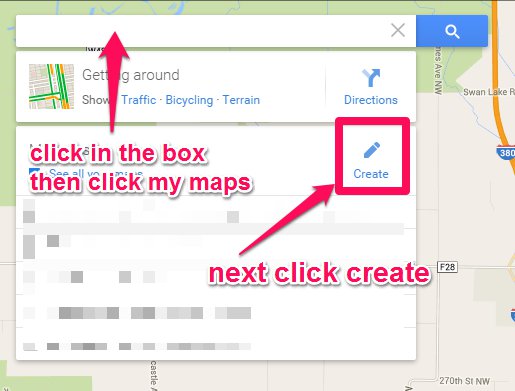 2) At this point you can rename your map as well as your first layer. 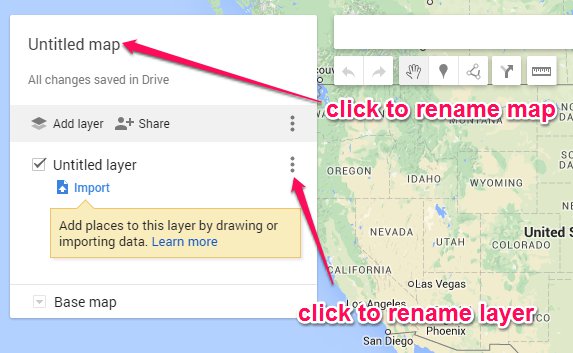 3) After renaming the map and layer, click the three dots on the newly renamed "layer" and choose to "open the data table. 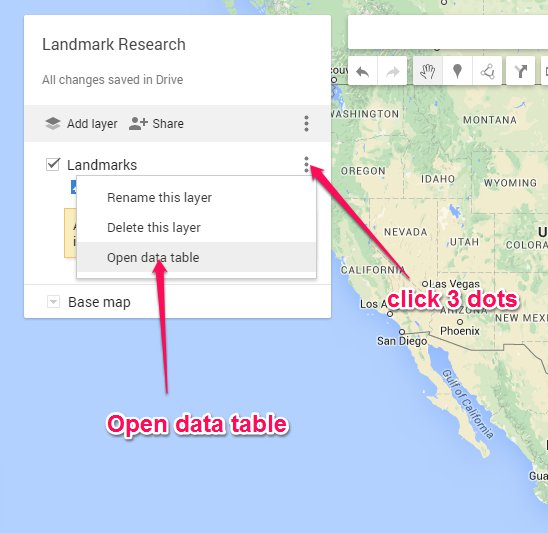 4) After opening the data table, you need to add a couple new columns. You can click the drop down arrow and choose to insert a column before or after. 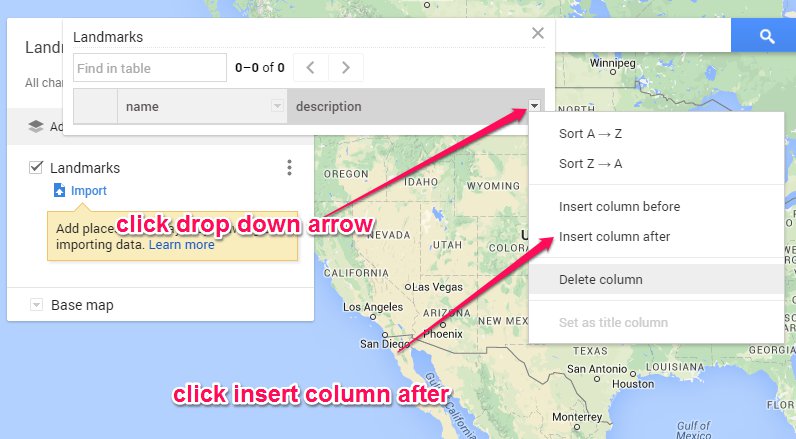 5) We added a Thinglink and YouTube column. We deleted the description column. 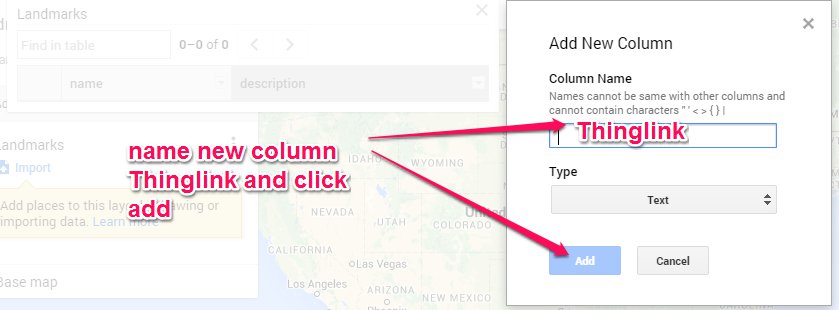 6) After adding the columns, you should be able to see the columns you will have being displayed in your "data table." 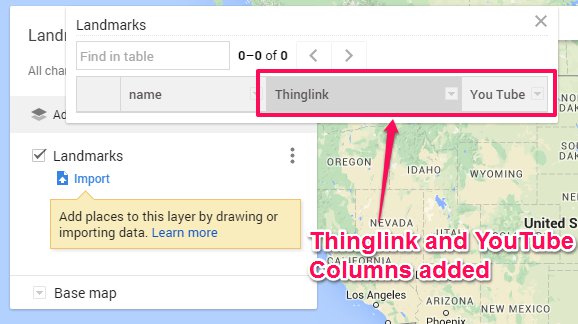 7) Once you have the data table all set up, you can share the map so your students can begin adding their landmark research. To do this, click the share button. 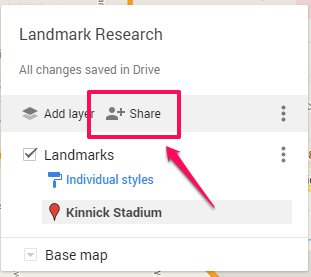 8) We set the link so that anyone who had the link could edit. The link that was provided was then shared with students. We shared it in Google Classroom so it was easy to access the map. After the map was finished, we went back in and set the sharing options to "view" only instead of editing. That made it so we could share the map with the world and not worry about someone being able to edit the map. 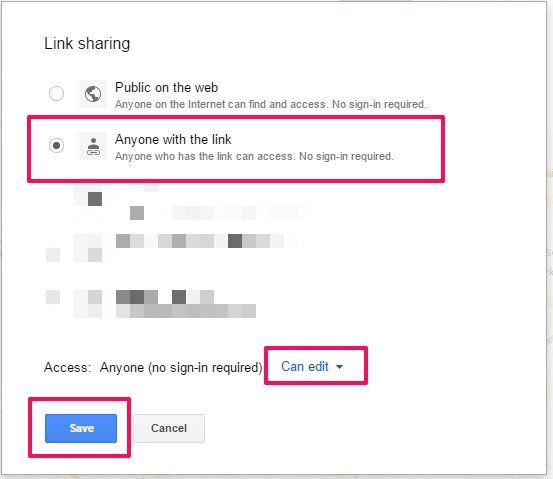 9) After sharing the map with students, they can click in the search bar at the top and search for their landmark. After their landmark is located, they can click on the green icon. This will allow them to click "add to map." 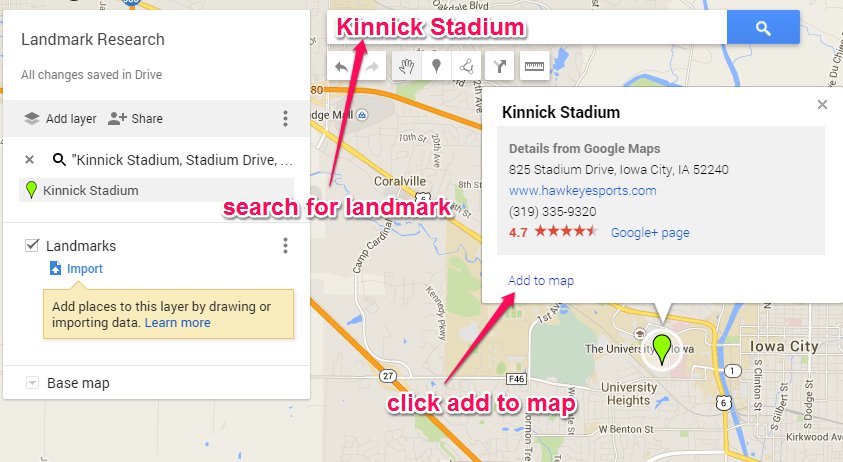 10) Once their landmark is added to the map, they will have the option to click a pencil on their landmark. This will allow them to edit the Thinglink and You Tube fields. Students can add in their links for both Thinglink and YouTube. Once done adding those URLs, they can click save. Their landmark is now added to the map. 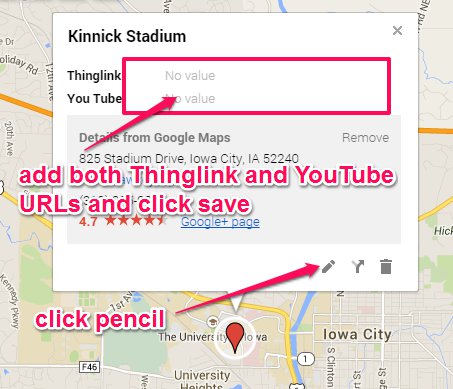 Changes This project was rushed a little faster than we would have liked. One of the 5th grade classes was piloting some Chromebooks so we had to finish this project before the Chromebooks went away. Looking back on this project, we would have liked to have students cite their sources and add a bibliography to either their Thinglink or their landmark on the Google Map. In addition, more time spent on finding images that students were allowed to use would have reinforced copyright laws. Lastly, after doing this project, we talked about doing some green screen movie making for their speeches. Having an image of their landmark as the background as they were doing their speech would have made their speech come to life even more. Share This:
3 Comments
The Plan..... We had been studying how to turn data into pie charts or "percent circles." I had planned to have students take some data, add it into Google Sheets, create a pie chart, save their chart as an image, and create a Thinglink to add "tags" to the slices of the pie chart. The Data and Chart... Our community is home to The University of Iowa. With it being NCAA basketball season, we decided to use some statistics from theIowa men's basketball team. 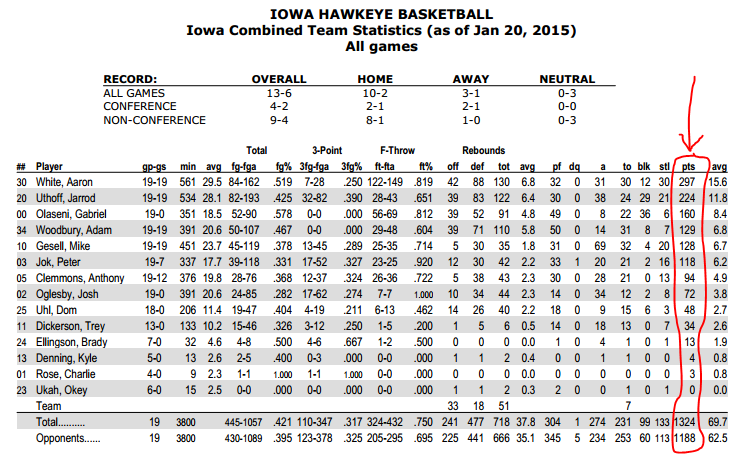 We started by looking at the total points scored by each player on the team. We took the data and put it into a Google Sheet. 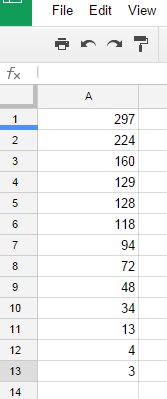 After the data was recorded in the Google Sheet, it was highlighted. After being highlighted, we clicked insert and chart. 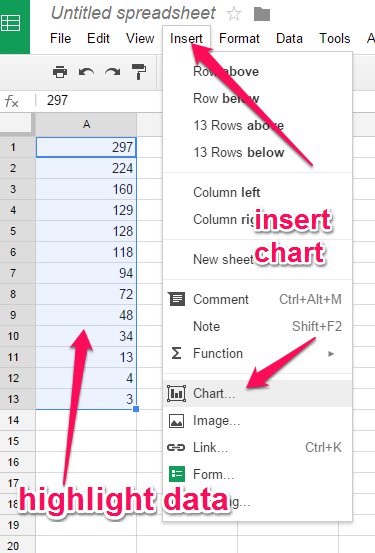 After selecting to insert chart, we selected "charts" and then we were able to choose "pie chart." 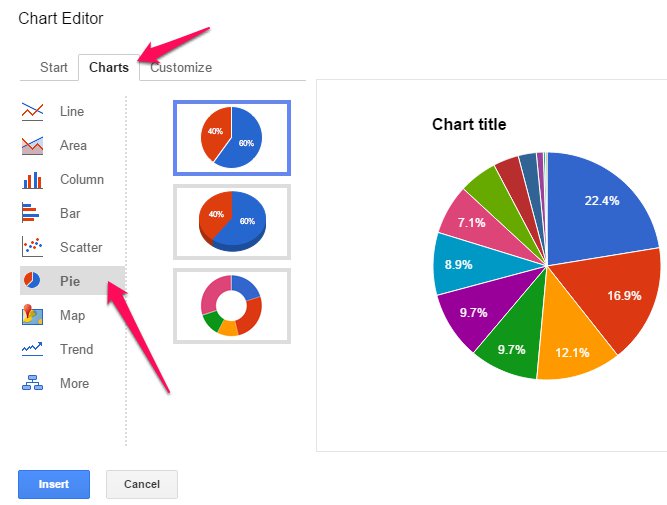 After the chart was chosen, we then clicked insert to get it into the Google Sheet. At this time, we took a screen shot of the pie chart. We saved the screen shot to our desktop for easy access. 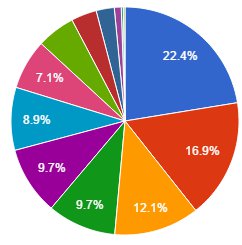 Thinglink... After our pie charts were saved to our desktops, we navigated to Thinglink. After signing into Thinglink, we clicked "create" to begin adding tags to our pie chart. 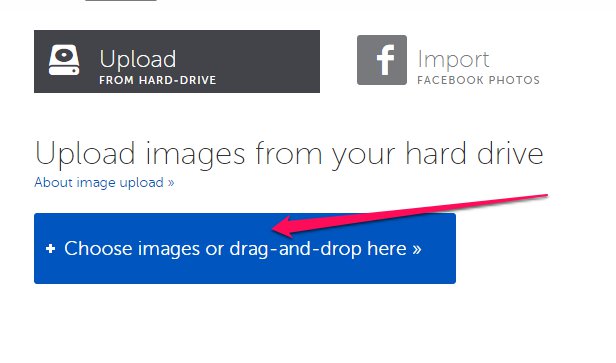 We chose to upload images. Students would select the image from their desktop. Once loaded in Thinglink, we gave our picture a title and added our first "tag." 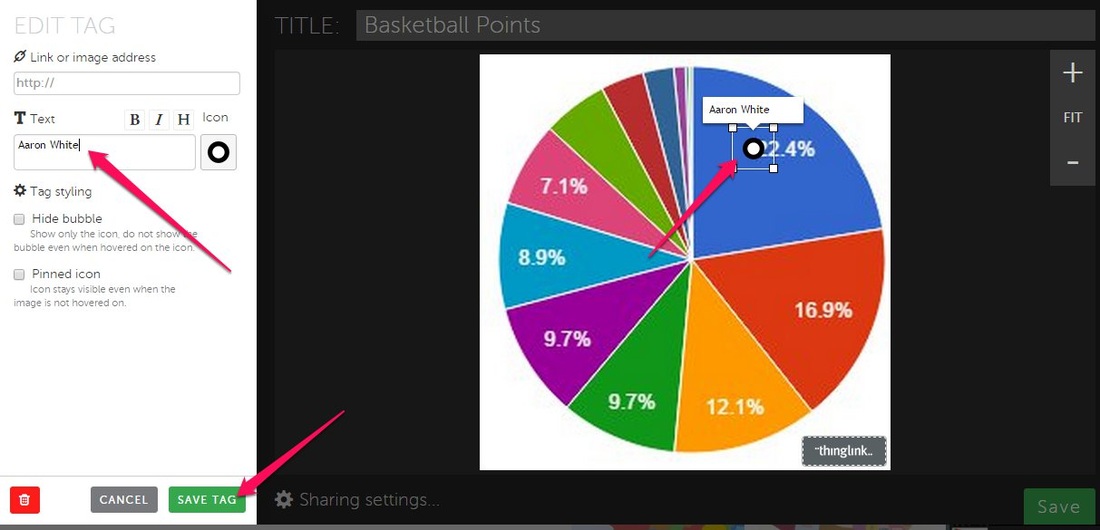 Students used the stats of the men's basketball team to correctly name the tags. Each tag was supposed to contain the name of the player who had scored that percent of the total points. This process was repeated for all slices in our pie chart. Upon completing their interactive image, they clicked share and copied the embed code. This embed code was then added to their Kidblog to share. The next step of this process was to look at more statistics from the men's basketball team. Take away... We could have done this same process using the provided data from the curriculum. However, to make this a more authentic experience, we chose to utilize some of the local information we had available. Students were able to make a connection with the data and knew almost all of the players. It was a fun way to practice pie charts in an authentic way. Share This:
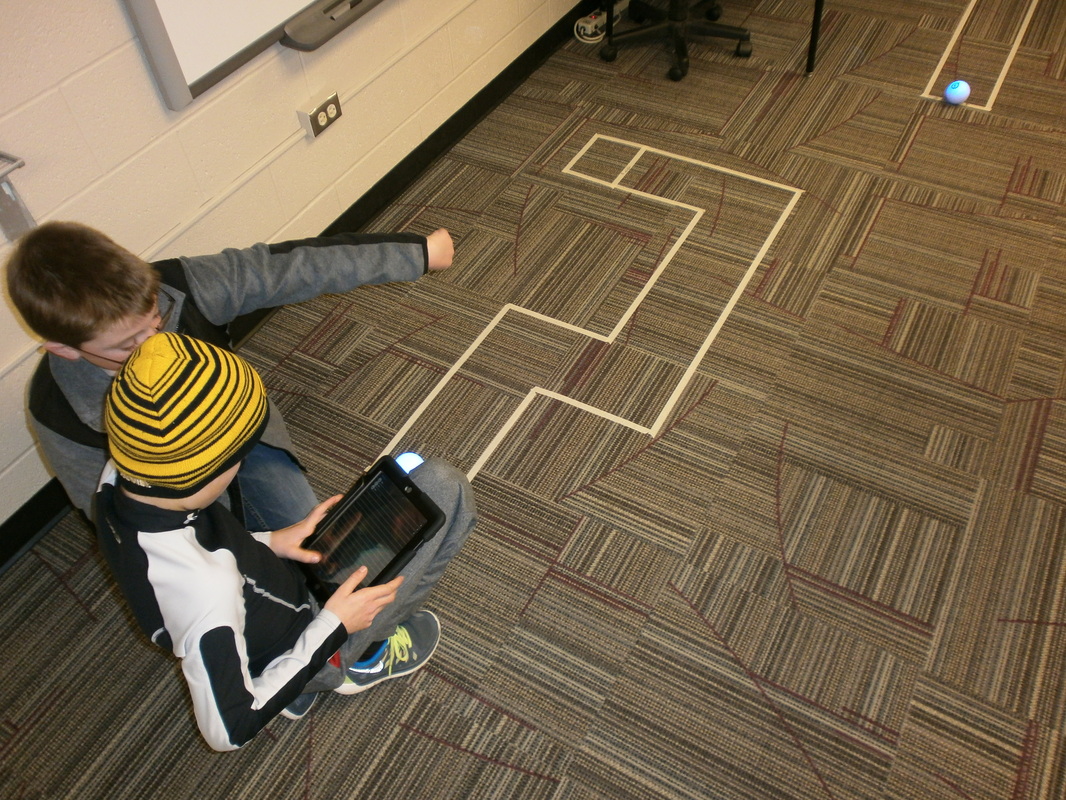
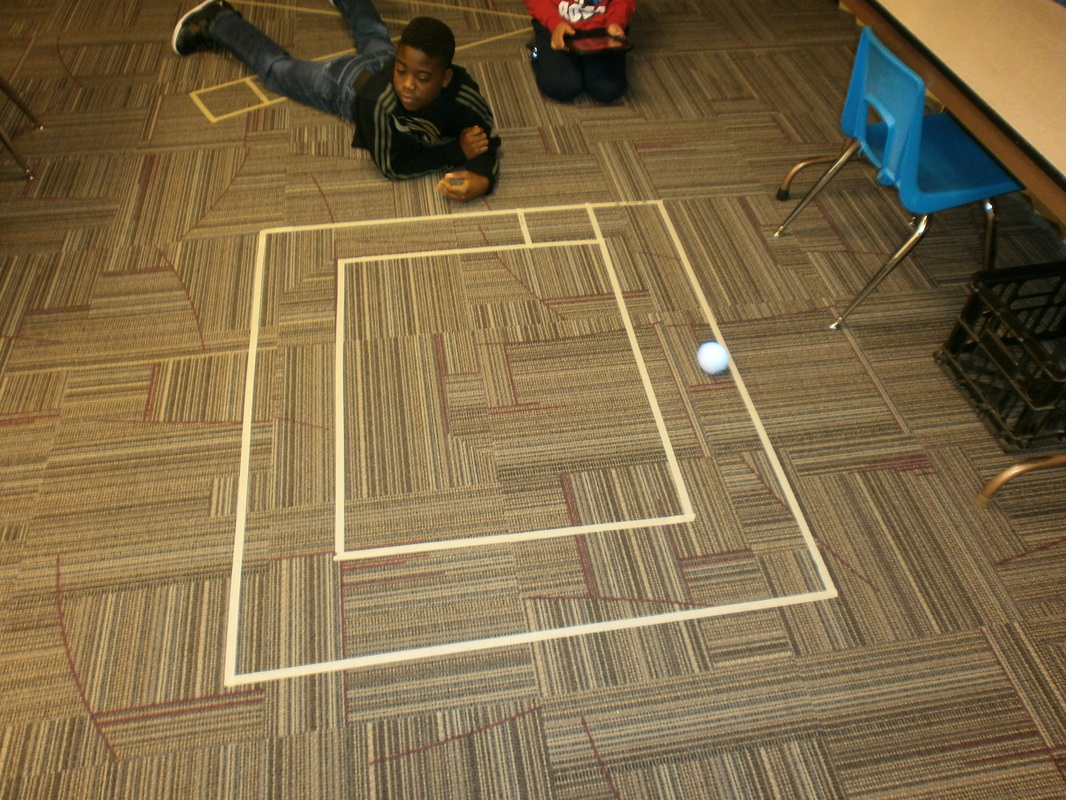
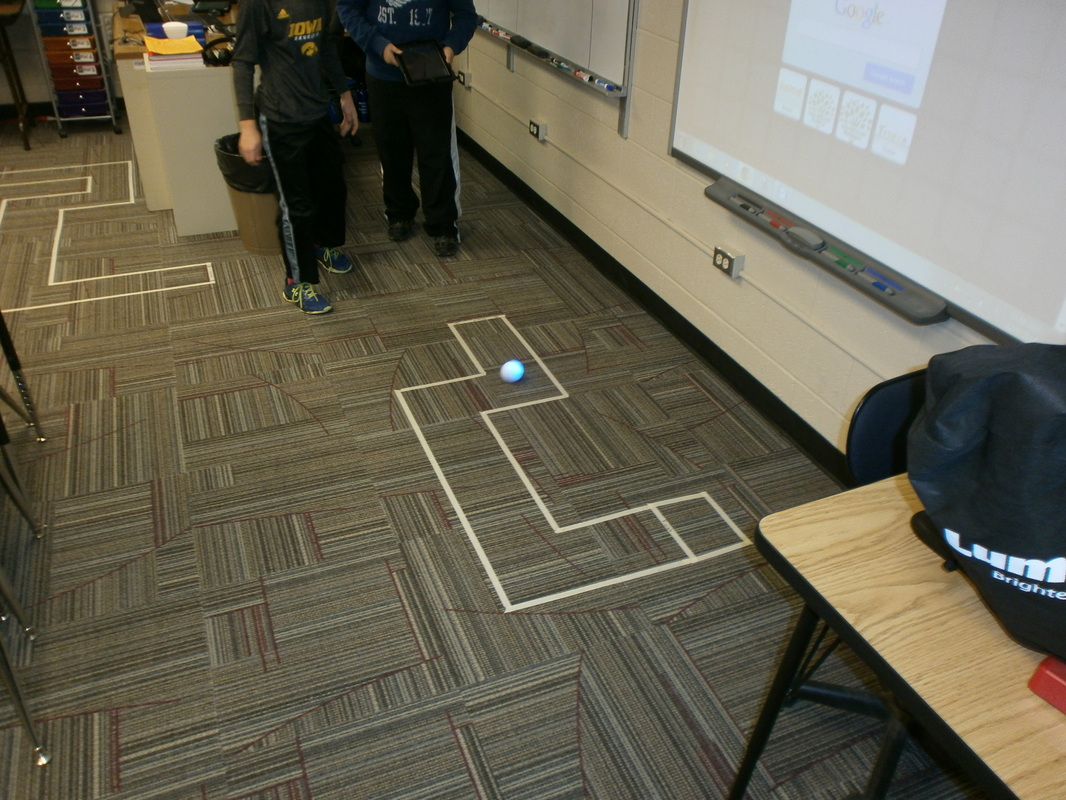
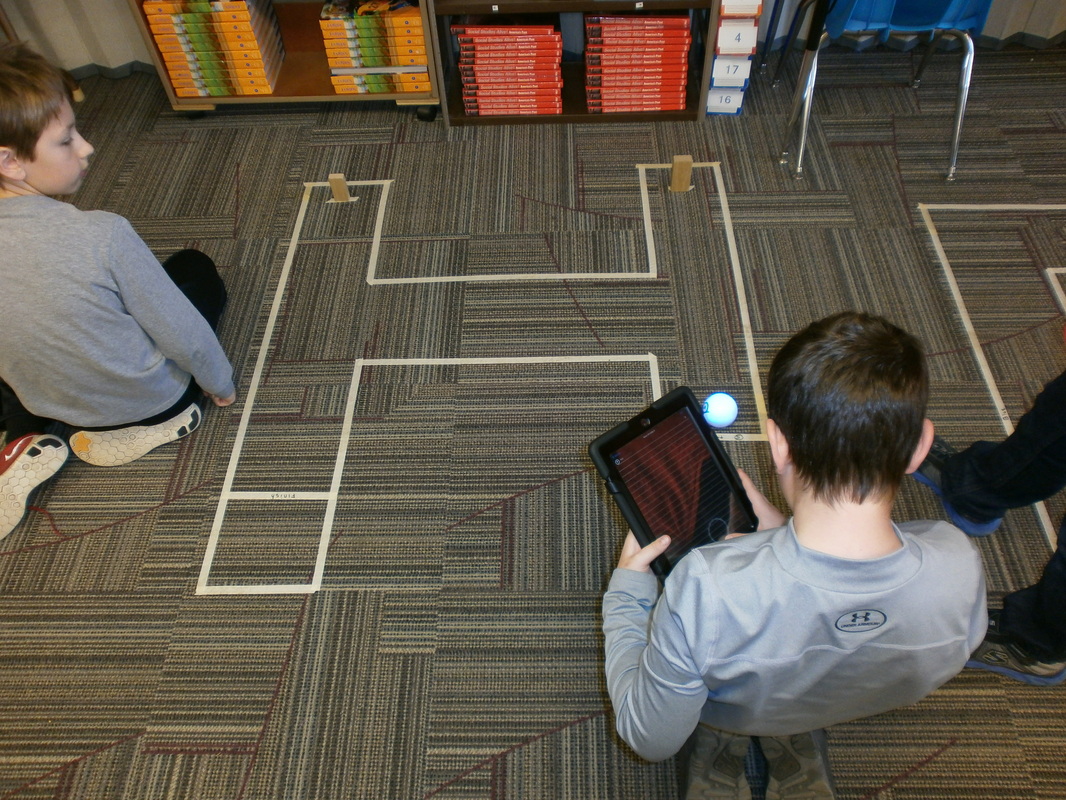
Sphero Robots are such an amazing tool for the classroom. During the hour of code my class had the chance to use Sphero 2.0. I had created a total of eight courses in our classroom using tape. Each course varied in turns, jumps, and speed. 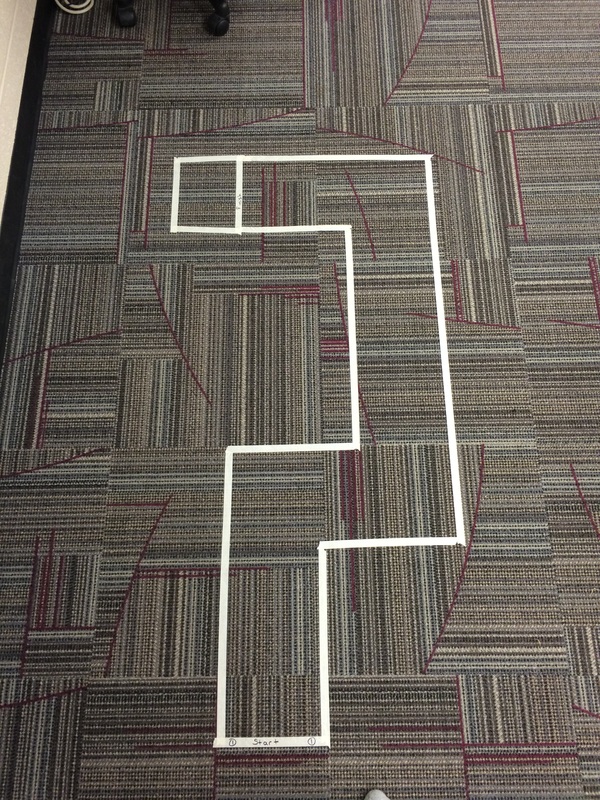  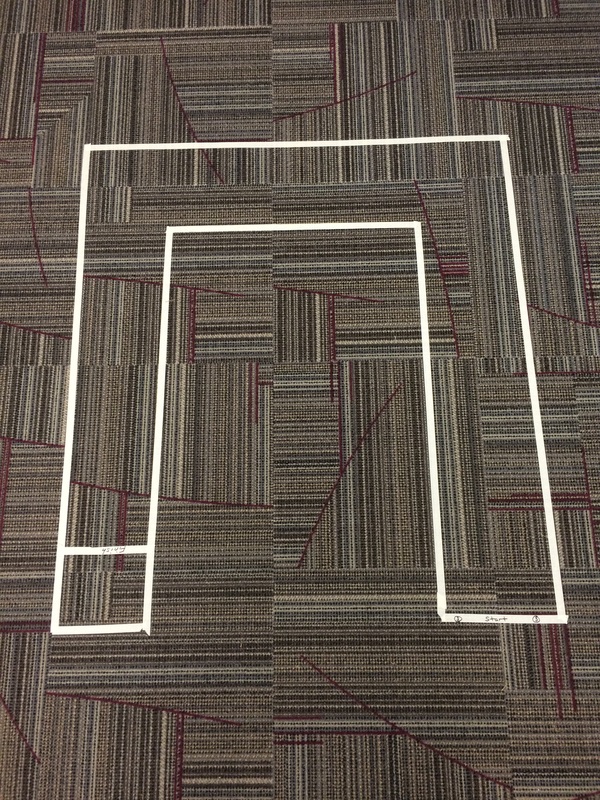 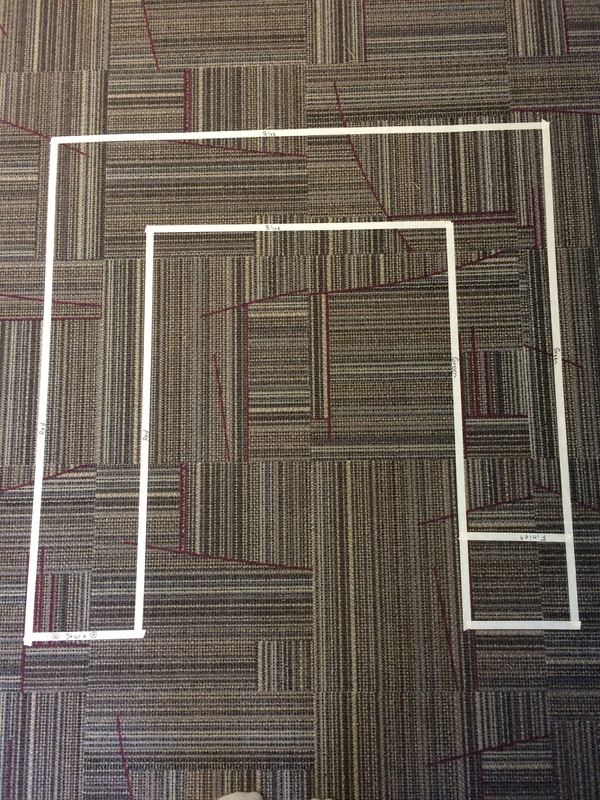 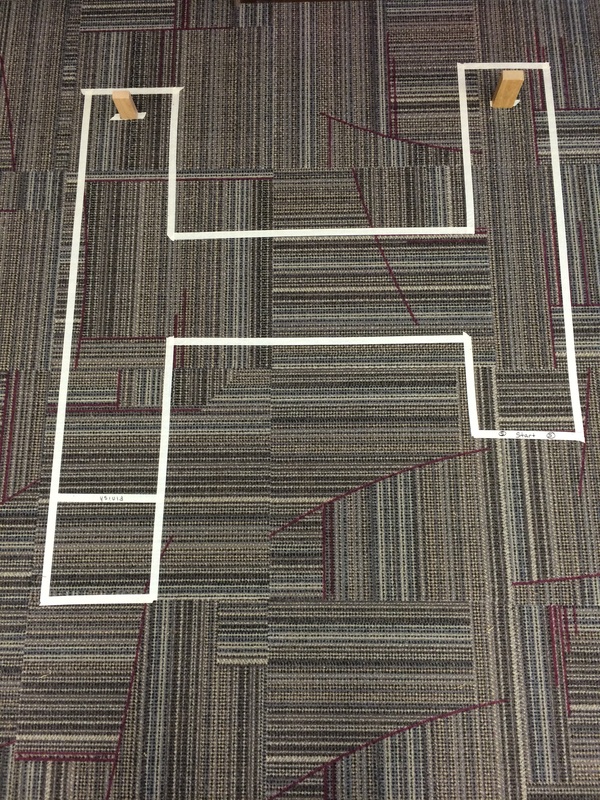 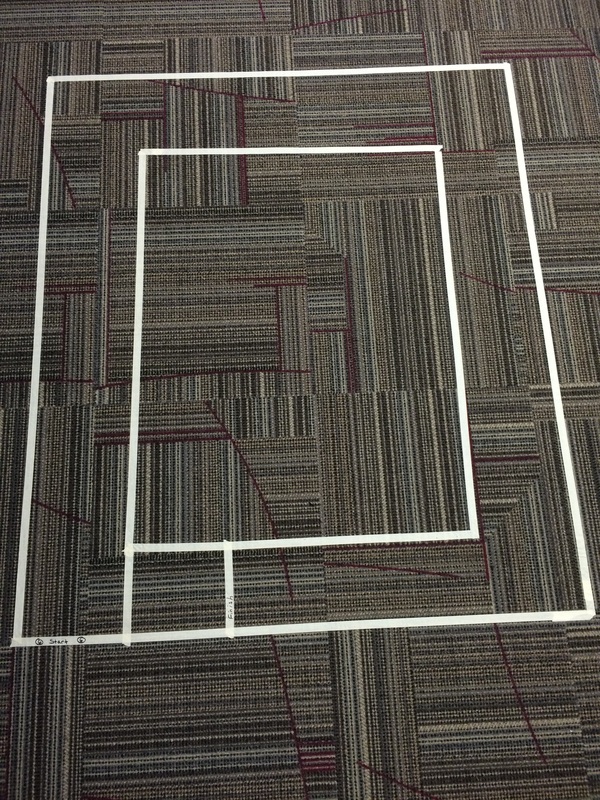  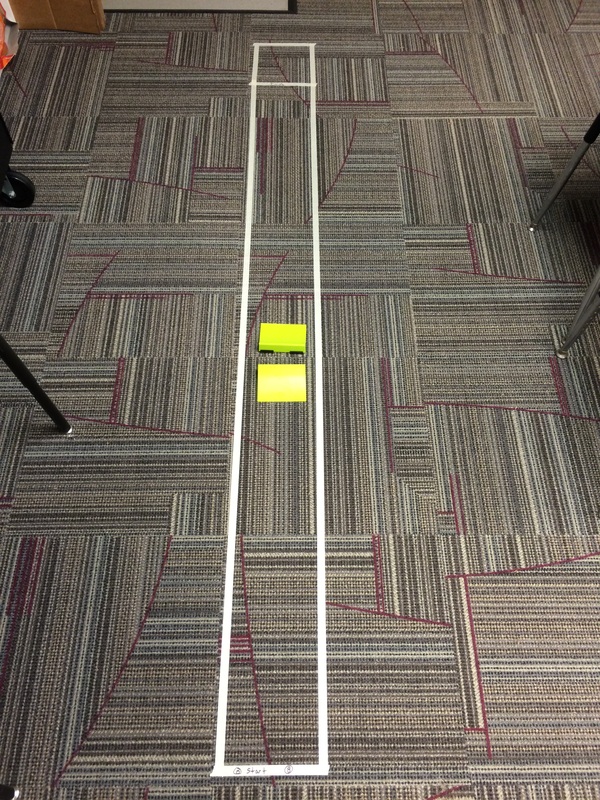 Using the Macrolab app, which is available for IOS and Android, students had to code the Sphero to complete the courses. Prior to students attempting to navigate the courses, I provided a brief mini-lesson over adding commands for the Sphero. We began by talking about the "taillight" and how this is used to orient the Sphero robot. This was a great opportunity to make a connection with math and how many degrees are in a circle. 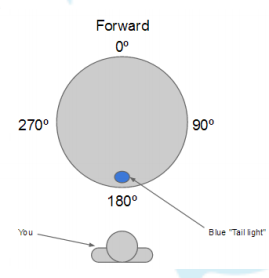
The next step was to talk about creating a "macro." You can see the image below has three buttons at the bottom. The plus sign at the bottom right allows students to create a new macro. We related it to having a folder to store all the commands you wanted the robot to do on a single course. 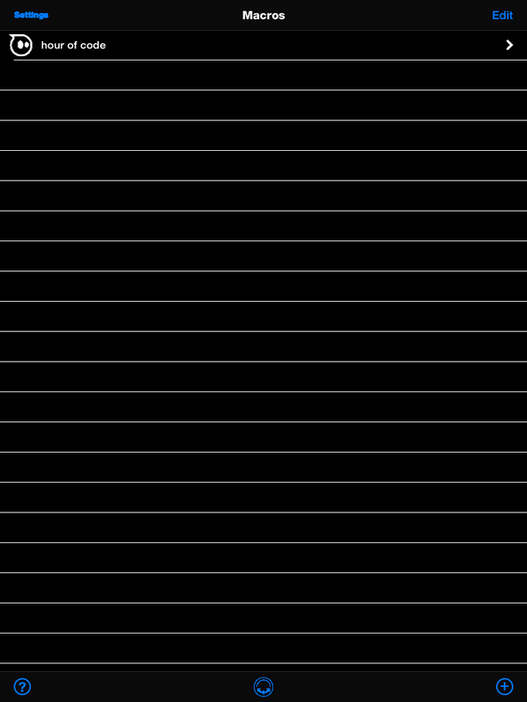
Once inside of the macro, students are able to select the commands they thought would be needed to complete the course. The common commands we discussed were the roll, stop and RGB commands. 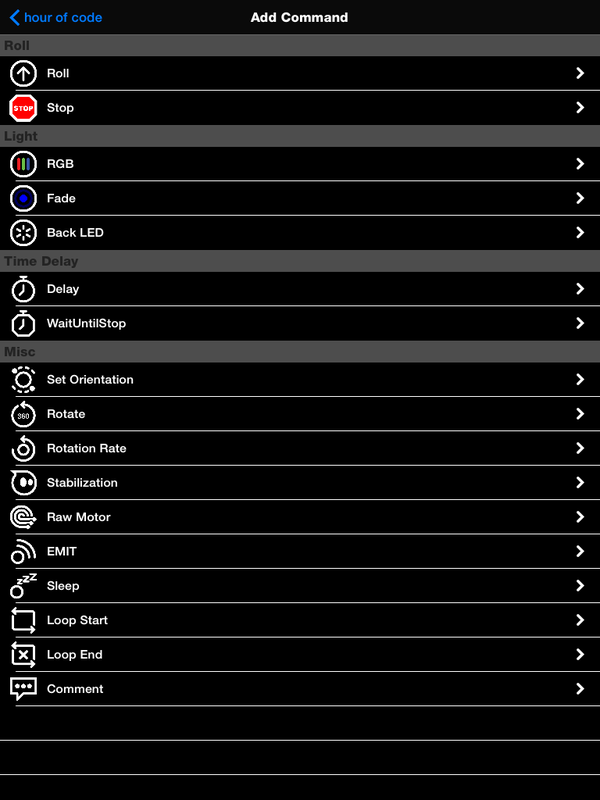
I also discussed how to manipulate the "roll" command. You can see below that you have the choice to customize the speed, heading and delay. We briefly talked about the heading and what right, left and straight would look like with a degree. One of the trickier pieces to wrap our heads around was the delay. It is in milliseconds which 1,000 ms equated to 1 full second. After covering some of the basics, students were off to explore the courses. 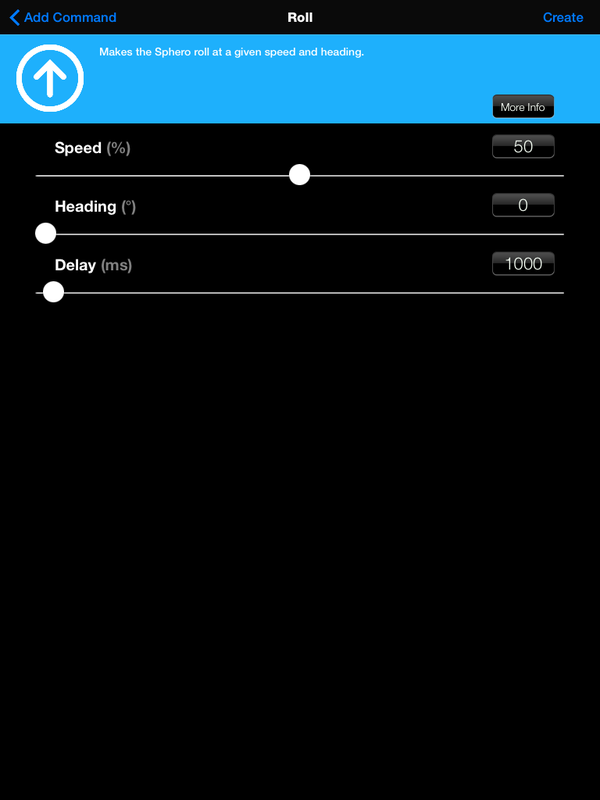
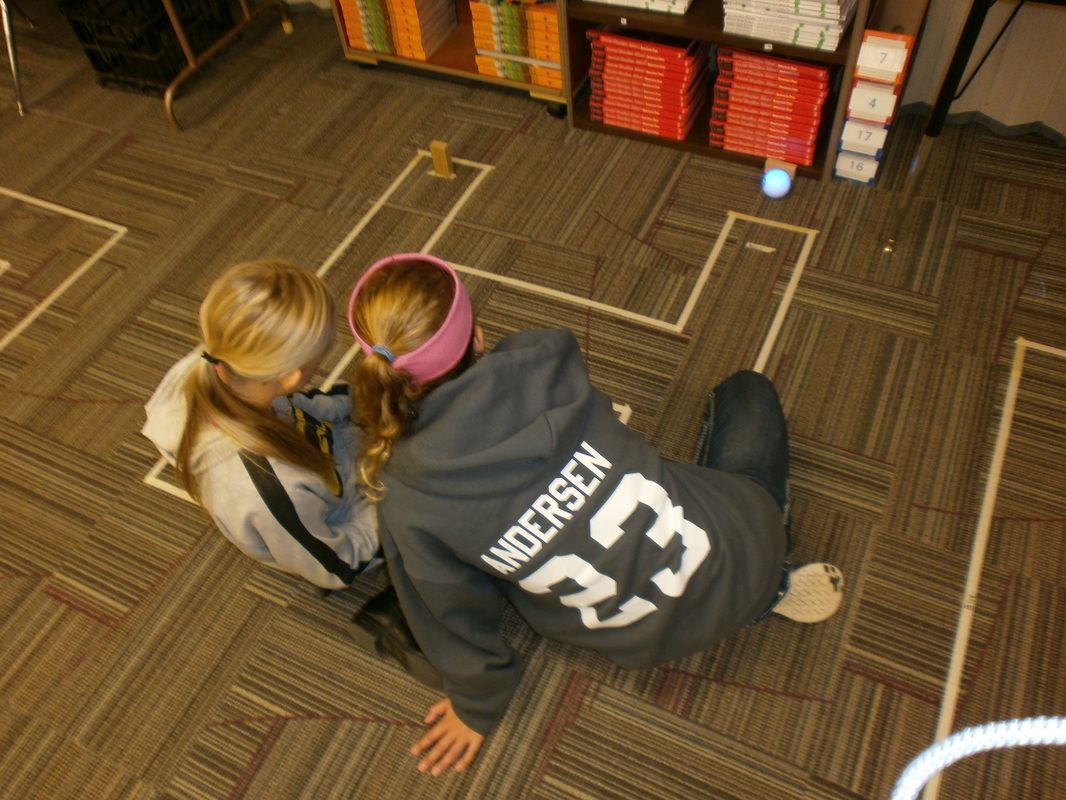
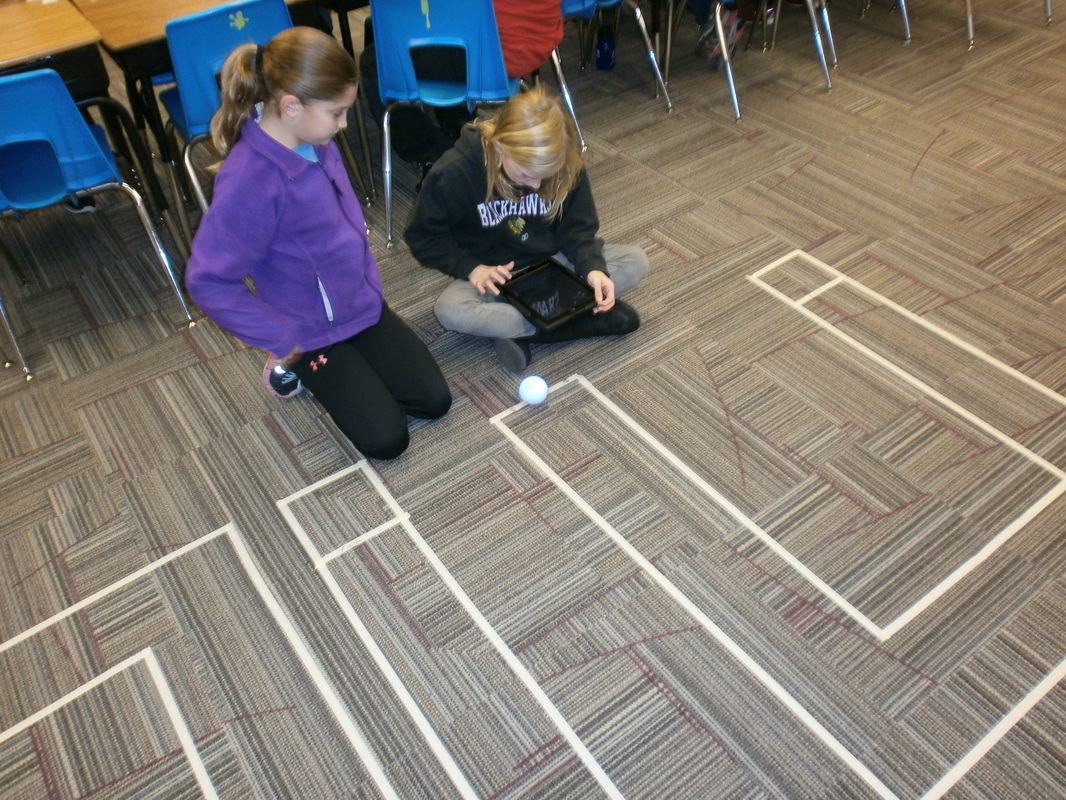
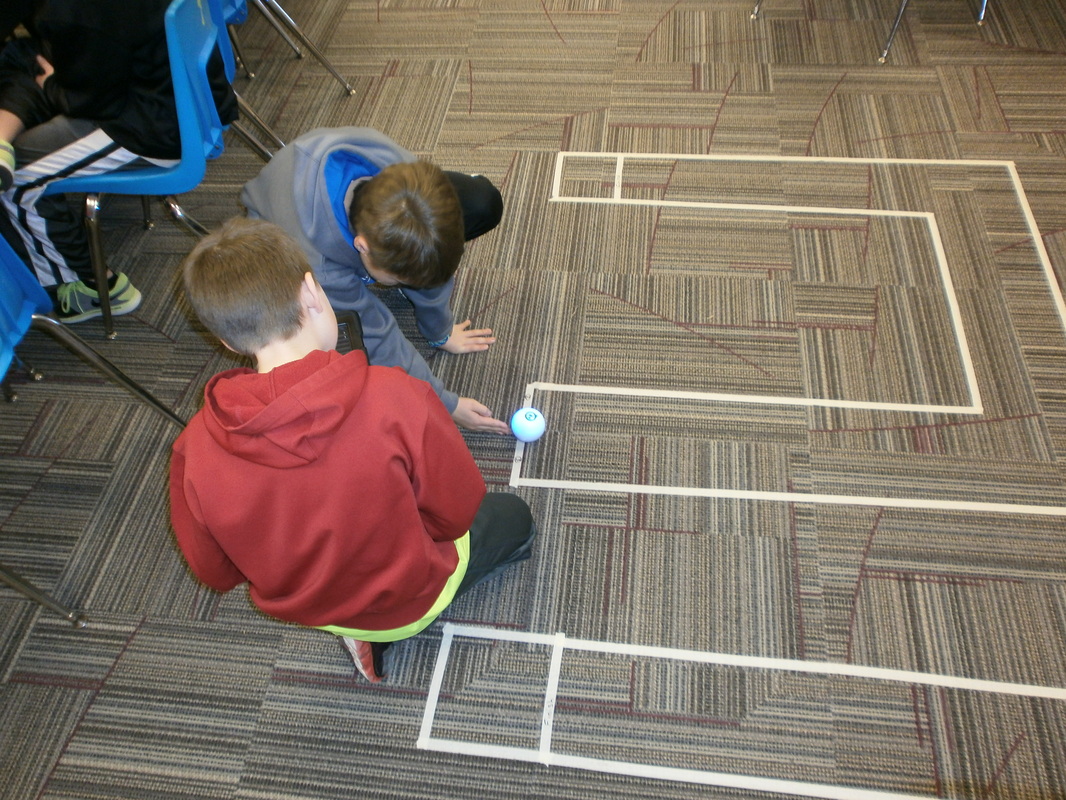
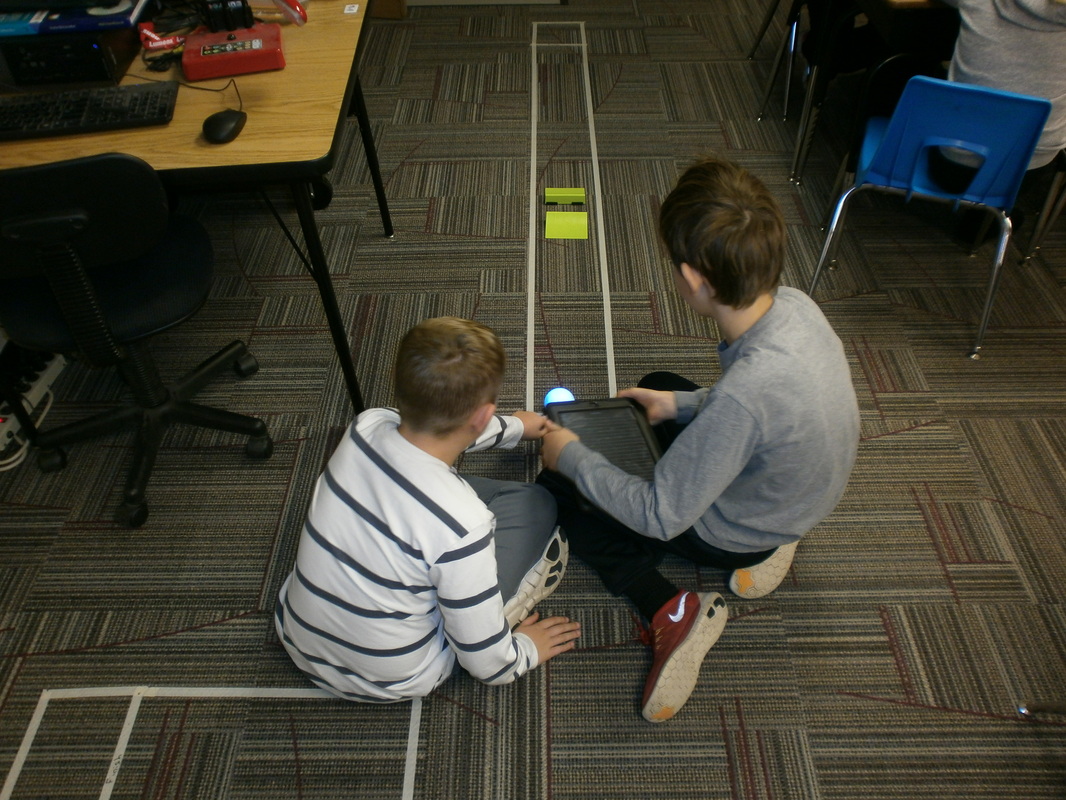
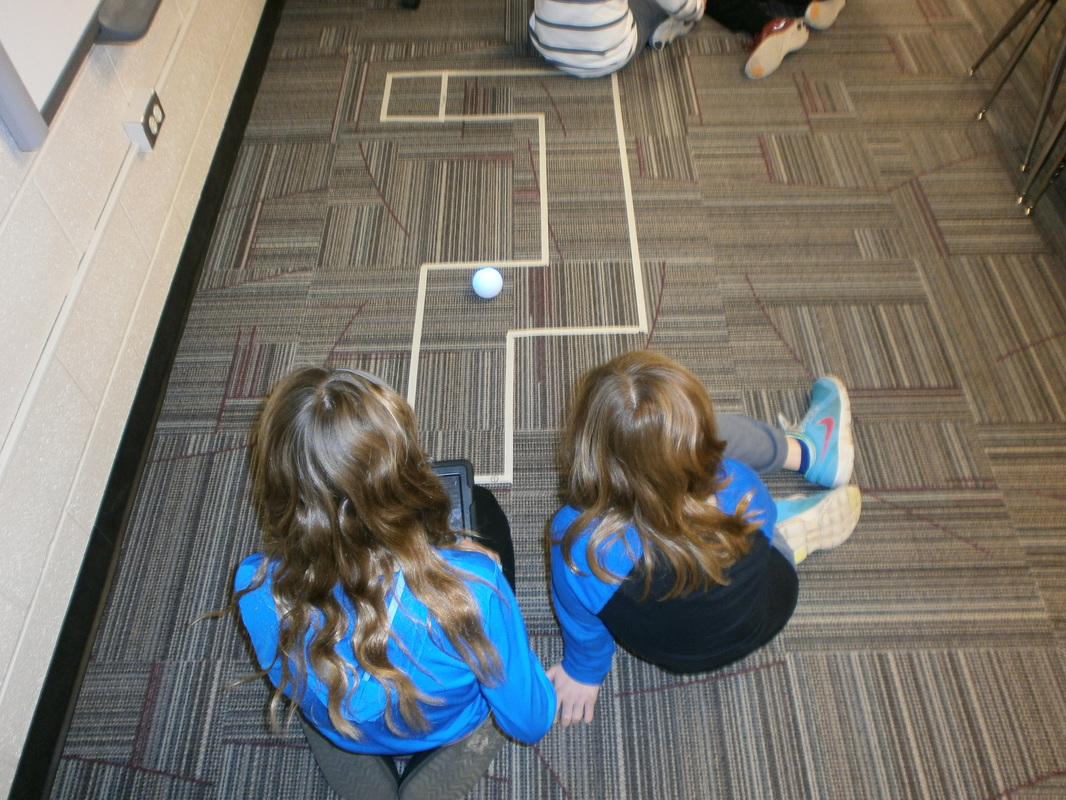
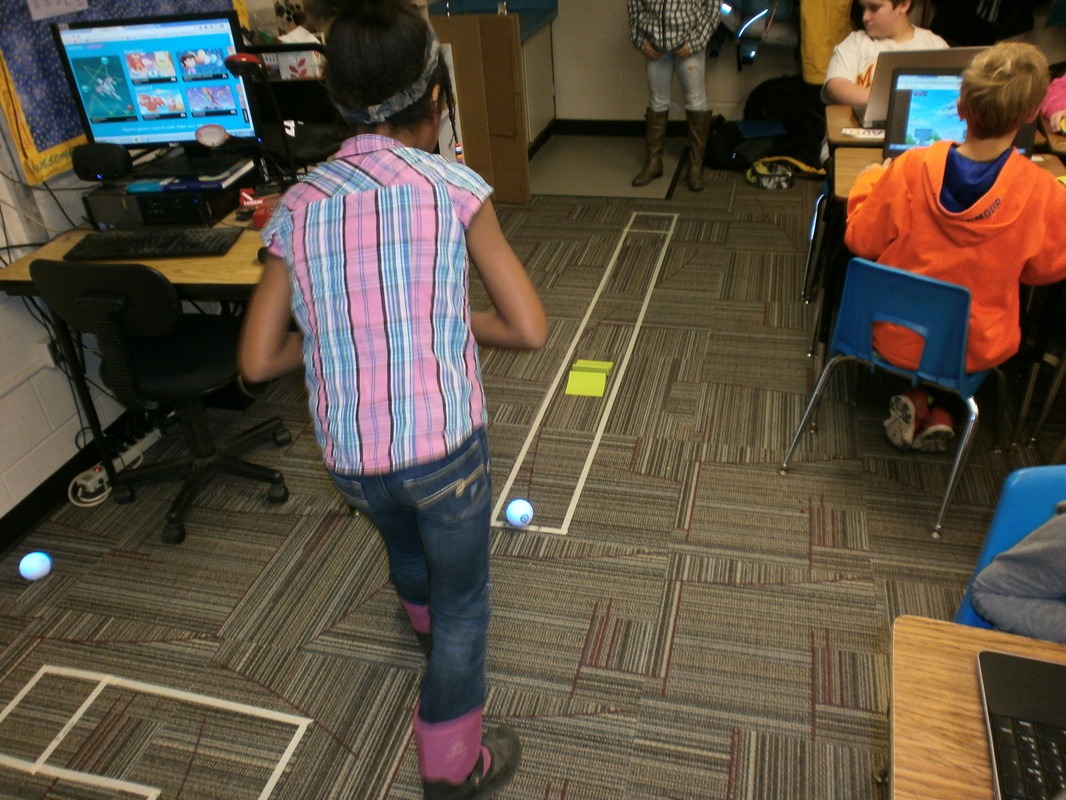
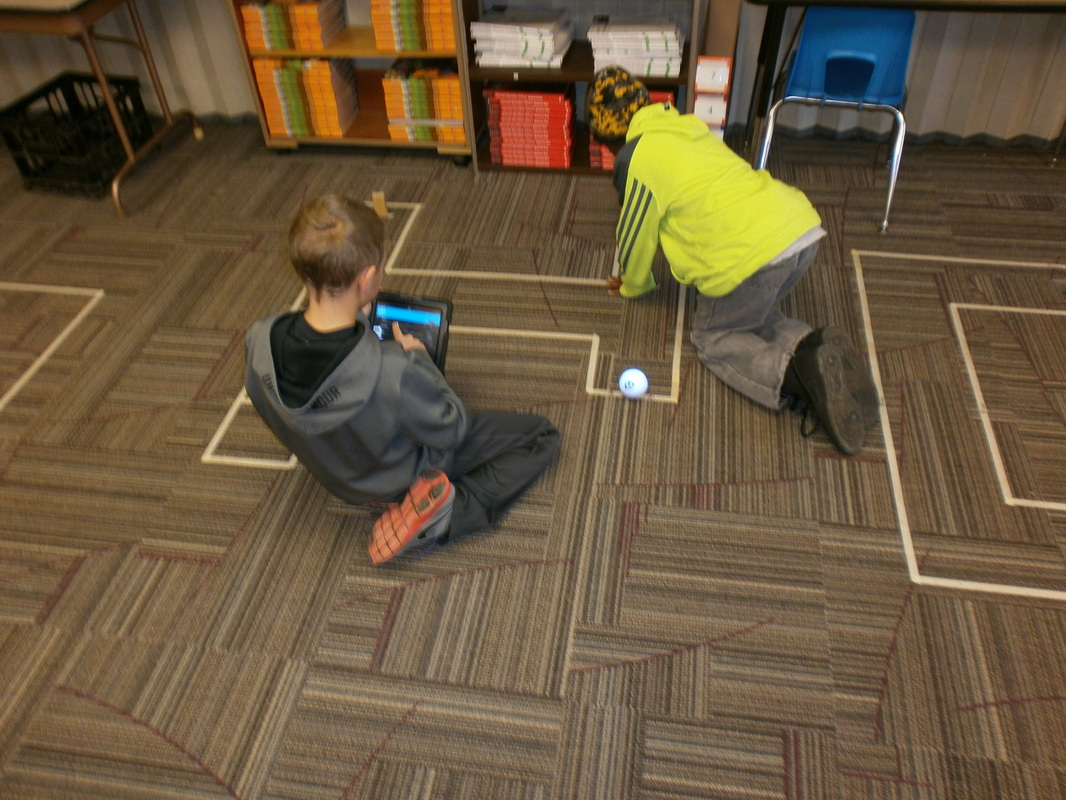
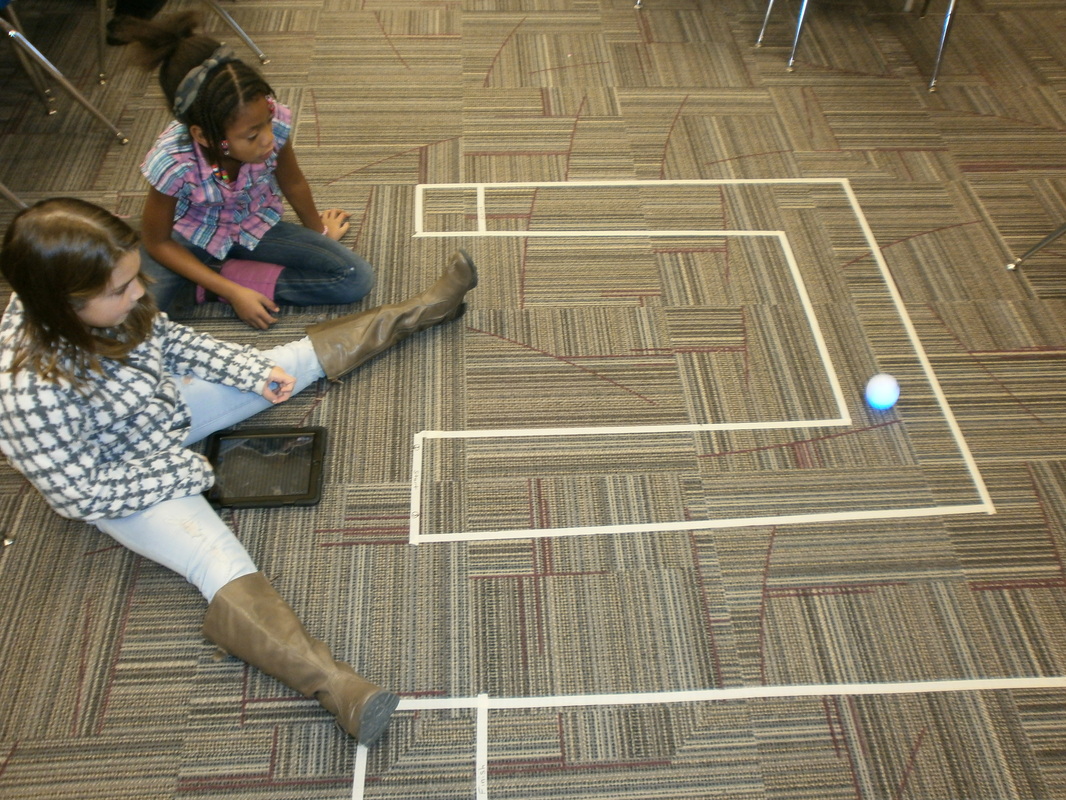
As students began to code the robotic balls to complete the courses, they quickly realized they would have to problem solve multiple times to get Sphero to complete the course. Here are two examples of students attempting to complete a course and failing. However, both groups did troubleshoot and successfully complete the courses. Reflecting back on this chance for students to utilize the robots I was able to see how powerful this tool is in a classroom. Everyday I had students asking if they got to do robots again. The conversations that took place between small groups as they tried to problem solve was priceless. I look forward to finding other curricular areas to integrate the robotic balls. Sphero robots and the hour of code was a huge success. Sphero EducationSphero even offers some great resources for teachers/parents. They have a program called SPRK (Students, Parents, Robots, Kids). This program has some user friendly lesson plans and resources to get your kids exploring with the Sphero robots.
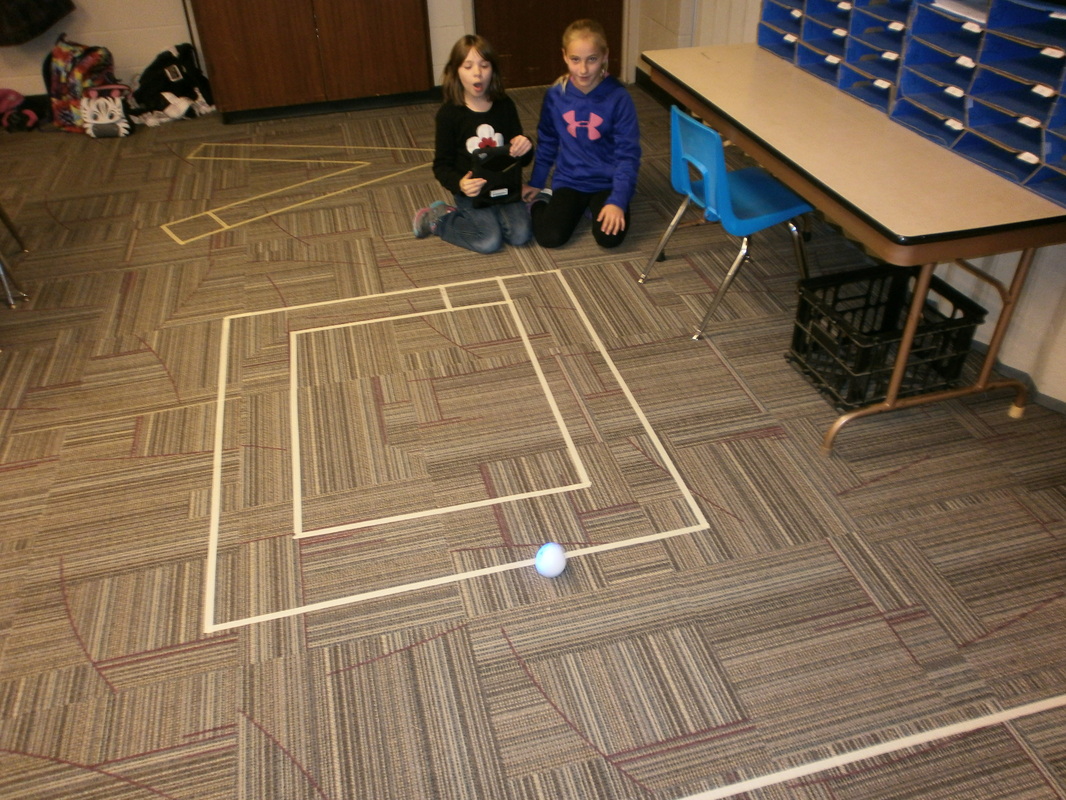
We had a fun time of coding in our classroom for the Hour of Code. We wanted to start basic and move towards more advanced skills by the end of the week. In addition, we wanted students to have some freedom in their creations along the way. Kodable Web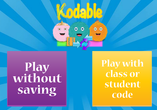 We started our week off with Kodable Web. This allowed students to learn some of the basics of coding conditions such as conditions, looping and more. It was great since Kodable starts basic and moves to more advanced skills. Kodable even has an app if you have tablets in your classroom. Tynker After Kodable Web, we moved onto the Tynker website for a couple of days. The students really enjoyed Tynker. There were beginner, intermediate and advanced levels of games. In each game, students had to use blocks to successfully complete a level/challenge. Tynker also has two options for IOS apps. You can do the school edition or a free version to learn coding skills. Scratch After students explored Tynker for a few days, we moved onto Scratch. Kids really enjoyed the flexibility of coding their own creations. The options were pretty much endless. We began learning about Scratch by using Scratch Cards. These are visual cards that teach students different skills to utilize in Scratch as they code. In addition, we used some Scratch Tutorial videos that added more options for students when building their creations. We concluded our exploration of Scratch by having students complete an "About Me" program. You can find an example of it here. It was awesome to see what kids were able to create by using Scratch. Khan Academy For those students that were interested in exploring typing the code, we gave them the opportunity to use Khan Academy. They specifically worked through the Hour of Drawing with Code. It is a little challenging but the tutorials help students work through the process of typing the code instead of using blocks. Sphero Robots In addition to using website to practice coding, students had the chance to use Sphero 2.0 robots. We used the app called Macrolab to program the robotic balls. It is available as anIOS app and Android App. I had created a total of eight courses of varying difficulty. Students worked in groups of two or three. They could choose which course they attempted to complete. After successfully completing a course, they were able to move onto another course of their choice. They had to problem solve when the robotic ball did not go on the course like they wanted it to do. It was awesome to hear the conversations that took place between students. Below are some pictures of students in action as they programmed the Sphero ball to complete the course.
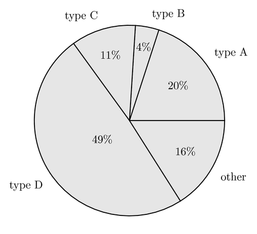
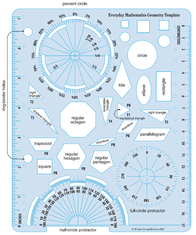
Once skill that is being practiced in fifth grade right now is creating pie charts. We have been talking about creating fractions, turning them into decimals, then into percents to create a pie chart using a template. 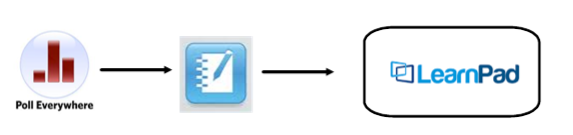 We used Poll Everywhere, SMART Notebook and our LearnPads to create an authentic experience for creating our own pie charts. Poll Everywhere To begin the activity, I create a total of five polls to have my class complete. I grouped them within the Poll Everywhere dashboard and labeled it as Pie Charts. 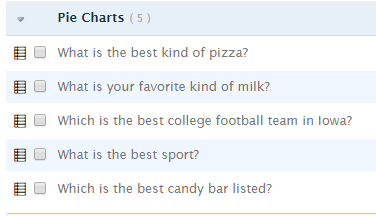 Students navigated to my custom URL to complete my polls. One of the five polls was displayed on the SMARTBoard while students completed the survey on their LearnPads. *Below is an image of what my students would see on their tablets. 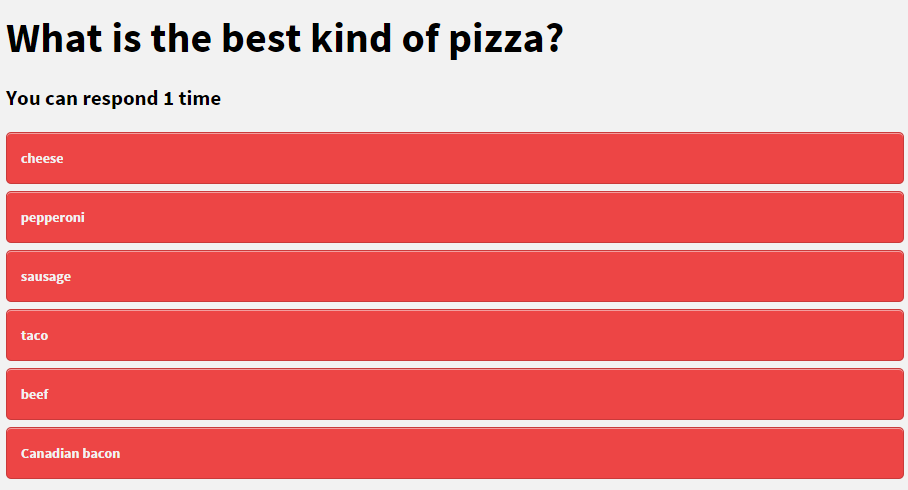 The students were able to see the results in real time as we took the poll. Once everyone in class had made a choice, I used the screen capture tool in my SMART Notebook software to snip the results and quickly put into a slide within SMART Notebook. 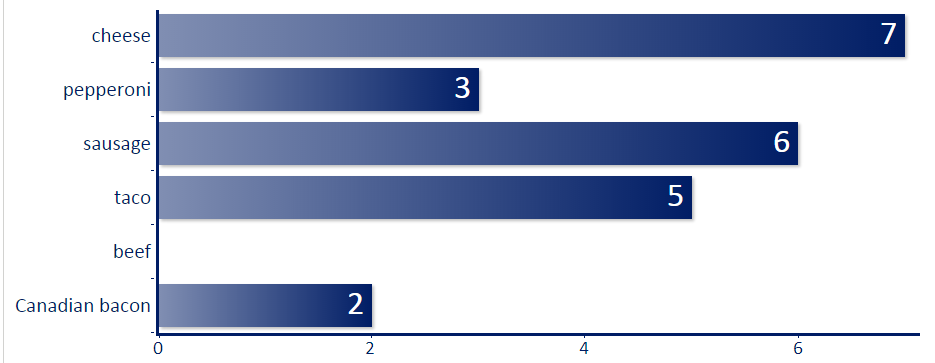 SMART Notebook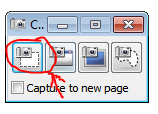 After using the snipping tool within SMART Notebook, I change the poll for students to continue completing all five of the polls. After each poll, I used the snipping tool to capture each result and put into the SMART Notebook software. 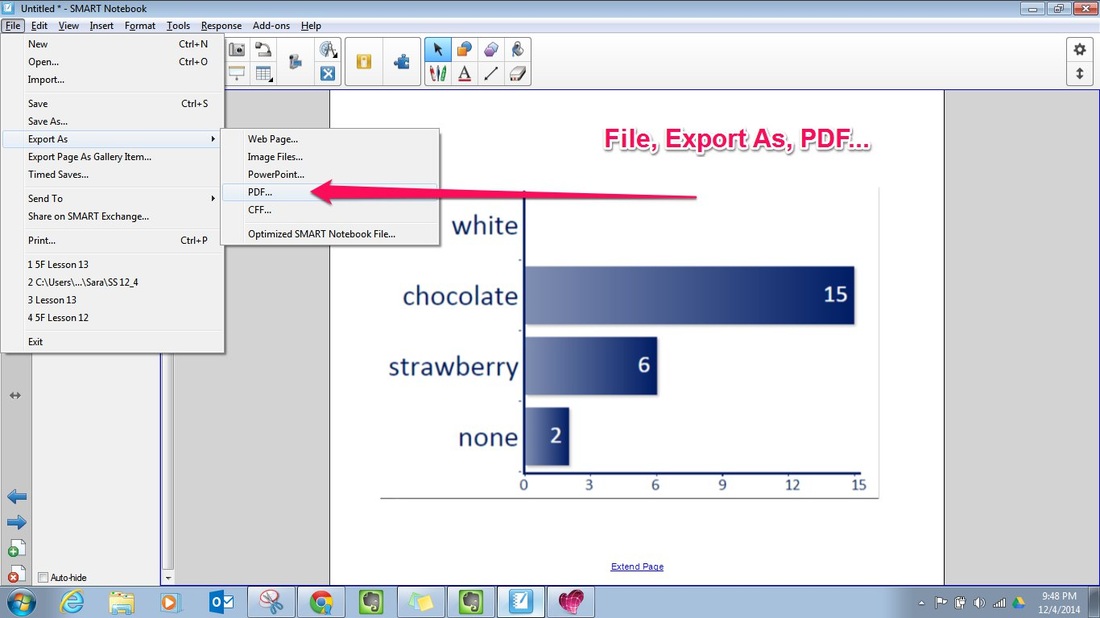 After all the polls were added into the SMART Notebook software, there is an option to export it as a PDF. This would be very similar to exporting a PowerPoint or Google Slideshow as a PDF. LearnPAD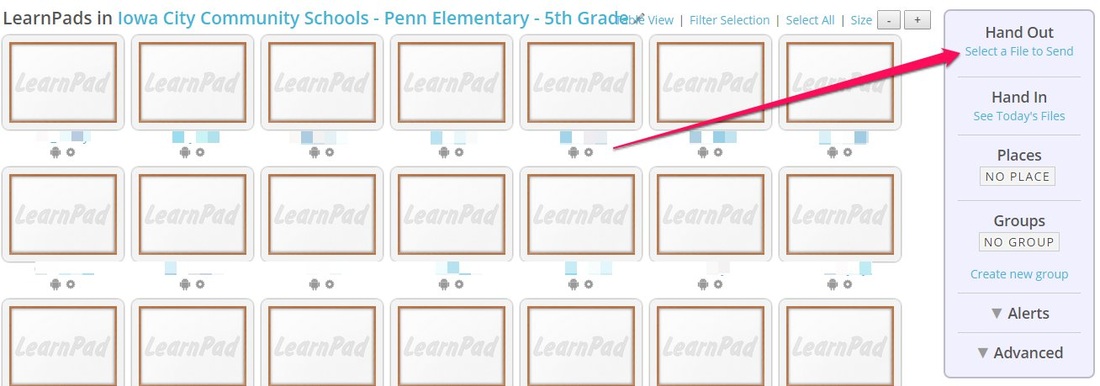 Once the file was exported to a PDF, I logged into my LearnPad Portal online. Within the dashboard, where I can see all my students' tablets, I have the option to "Hand out" a file. I selected the "Pie Chart" PDF file and it was automatically sent to all the students' LearnPads. This allowed all of them to access the PDF results on their LearnPads. Pie Charts To wrap up the assignment, students used the data gathered from the Poll Everywhere Polls to create their own pie charts. They used the template above to correctly divide their pie charts. They had to create fractions of the data, convert to decimals and then finally into percents. Once they had the percents, there were able to correctly divide their circles into the correct portions. The students really enjoyed the chance of creating their own data together using Poll Everywhere and then having the chance to turn it into pie charts. Share This: Recently we began studying about early colonies in social studies class. In an attempt to make the study more interactive and engaging, we utilized Google Maps to create our own maps. Not only did the students mark some of the colonies, but they were able to add their own information to each place marker they added to their maps. This idea was initiated while attending the ITEC conference in October. I attended a Google Map making session presented by Jim Sill. I didn't know how making Google Maps would apply to my own classroom, but I had heard great things about him and decided to attend. It was a game changer for sure. You can see an example of the final maps here. I will outline the steps of this process below. My students really enjoyed this activity. It really helped them connect with current day United States and where colonies were established hundreds of years ago. The Map Making process Step 1: You will need to visit maps.google.com We are a GAFE so all my students were logged into their Google Accounts when navigating to maps.google.com Step 2: Click into the map search bar and you will be given the option "My maps". 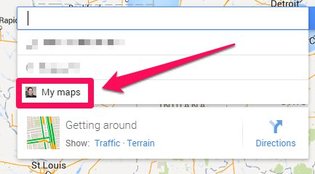 Step 3: Click create to begin creating your own map 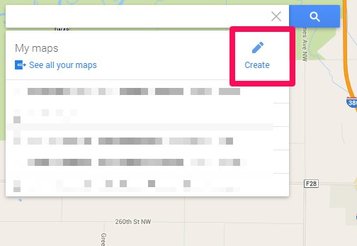 Step 4: Rename your map and rename your first layer according to your project. We renamed our first layer to "Early Settlements." 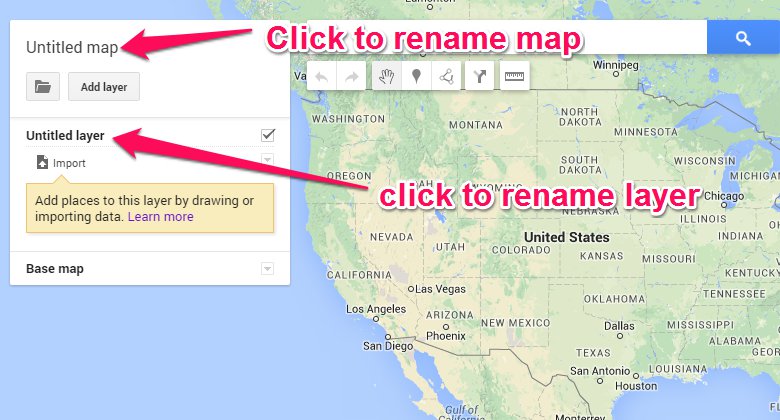 Step 5: Type the name of your first location you want to add to your map by typing its name in the Google Map search bar at the top of your map. You can then choose to add the location to your map. 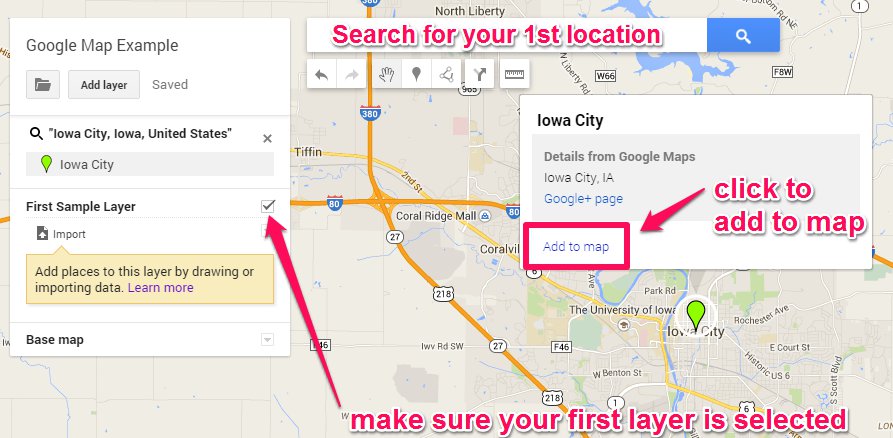 Step 6: After you have added one location to your first layer, you should now have a "data" option for your first layer. Select this "data" option to change your data fields. 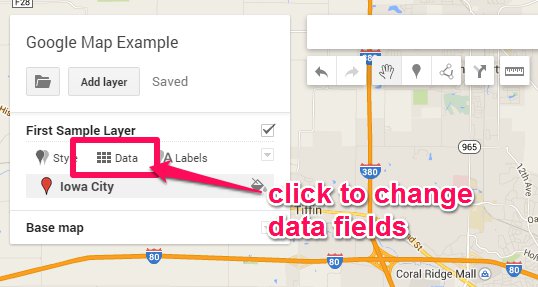 Step 7: Once you have clicked "data", a small insert will open that looks like a Google Sheet. You can then add/delete columns. You only need to do this once for this layer. Every time you add a new location for this layer, the data fields will apply to every location you add. 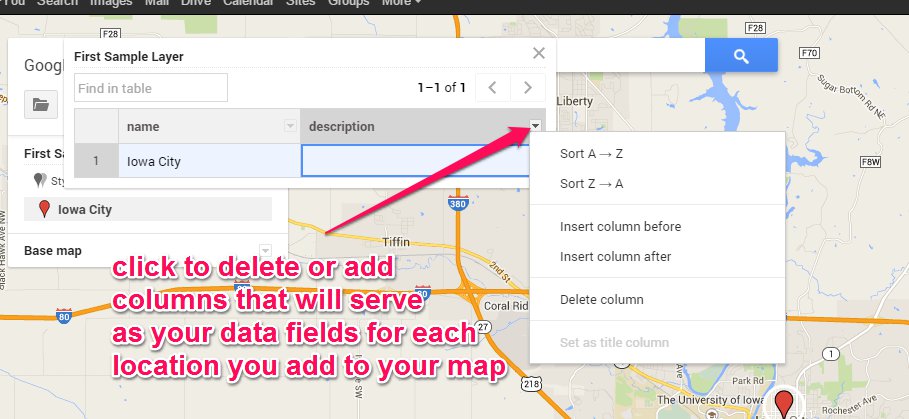 Step 8: After you have customized your "data" table, you can then add more locations to your chosen layer and customize the information for each location you add. 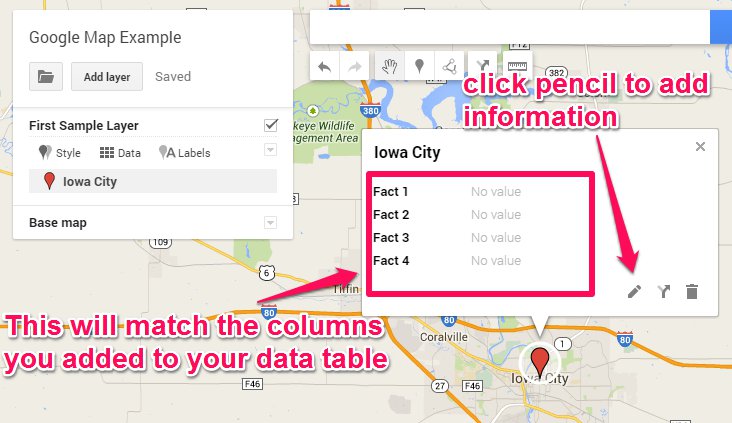 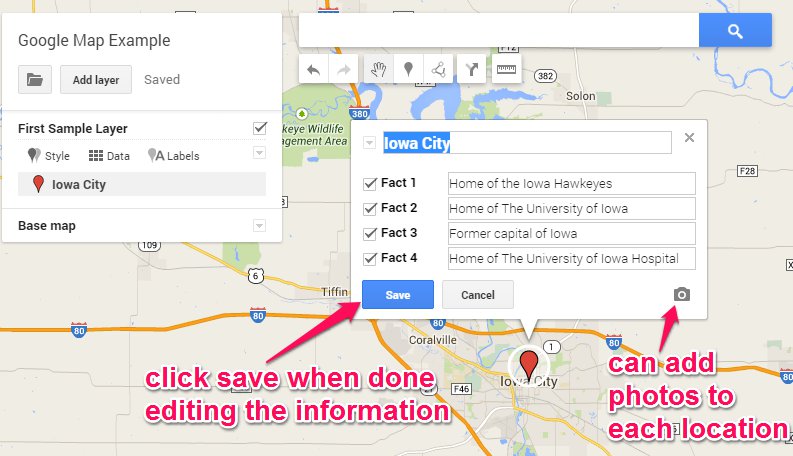 Step 9: You can continue to add more locations to your layer. You will be able to fill out information about each location you add. In addition, you can add more layers. However, when you add a new layer, your "data" table will need to be created again. Your data tables do not transfer from one layer to the next. Conclusion I was able to apply this Google Map making process to my social studies classroom. There are tons of other ways to integrate this across curricular areas. Check out Jim Sill's page on ways to integrate both Google Earth and Maps into your classroom. Share This: Our target skill for this week was conclusions. We began by watching the YouTube video below.  After watching the video, we talked about drawing a conclusion. We were able to conclude that the cake was made for his mother. After our brief discussion, we wanted to practice our skill. I put together some QR Codes to assist with practicing conclusions. I had my students use their LearnPads to scan codes using the ScanLife app. In addition, I had created a quiz using Socrative. Students opened up both apps and were able to toggle back and forth. They scanned a code with the ScanLife app and then provided their answer within the Socrative app. The QR Codes provided three of four statements. These statements were clues that students could use to conclude what was taking place. For example, 1) Your mom takes your temperature, 2) You have to stay in bed all day, 3) You eat soup. Based on these clues, a student could conclude that you are sick. If you would like to use the QR Codes, you can access them here. There are a total of six "mystery conclusions" for students to solve. You can add the Socrative quiz by using the following: SOC #: 13411210 This activity got them out of their seats as well as provided some practice with drawing conclusions.
During our reading group rotations I had students apply their understanding of conclusions by creating their own mystery conclusions. To accomplish this, students used iClipart for Schools. They located three to six pictures that they could use as clues for an activity of their choice. Once they had their pictures, they opened up the Pic Collage app and created a collage of their three to six pictures. Their collage was saved to their Google Drive accounts. The final step was to create a new post using Kidblog. They titled their post Conclusions and inserted their collage from their Google Drive account. Tomorrow we will be spending time during reading rotations leaving comments on each post about conclusions. We will leave our "conclusion" guess in the comment box on each of our classmates. This process of creating their own conclusion collage required them to think critically about which pictures should be used to represent their activity. In addition, they had to apply their understanding of conclusions in order to leave a comment on each others' blog post. Below are some example collages that my students created during this process. 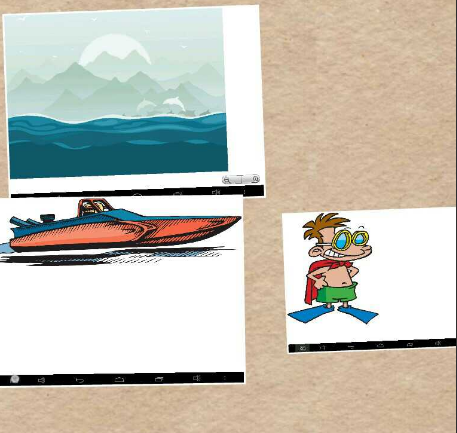   Share This: I recently had the privilege of attending the ITEC Conference in Des Moines, Iowa. I was able to attend some great sessions by Aaron Maurer. His hands on sessions highlighted how powerful play/tinkering can be in the classroom. Upon returning to my 5th graders, I have been working on the idea of a Maker Space within my classroom. I want to harness the power of students being able to tinker, play, invent, collaborate and learn from the successes and failures along the way. One challenge was gathering the materials that I needed to launch this space in my classroom.  I contacted a local bank, The University of Iowa Community Credit Union, about a grant. They had an online application that I could fill out and submit for a grant. They were awesome and supportive of my proposal. They will be providing some significant funds to purchase materials to get my Maker Space up and going. Thanks to the Credit Union! To keep track of my Maker Space ideas, I began cataloging items in a spreadsheet. You can see the document embedded below. You can access the most recent version by clicking here. Pixel Press Floors To kick off my maker space, we began with the app Pixel Press Floors. If you are unfamiliar with this app, check out this video. In a nutshell, it is an app that lets students design their own video games. On the education portion of Pixel Press' website, they have pre-made lesson plans. They have a one day lesson plan as well as a five day lesson plan. They are very easy to follow and perfect for opening your students' eyes to all the possibilities. My class will be using the five day lesson plan. We kicked off the new maker space along with Pixel Press Floors today. We watched the video and then I let the students play levels from the arcade to begin exploring some of the different elements they may want to add to their own designs. Tomorrow we will begin creating our interview questions and interviewing "gamers" to develop empathy in the design process. My students are super excited to work through this project. I will be documenting our journey. Can't wait to see what they learn as well as what I will be able to learn along the way. Share This: One of the ways that I stay up to date with the latest in ed tech is subscribing to numerous ed tech blogs. I used to use Google Reader to manage all of my RSS feeds. However, since the death of Google Reader, I switched over to Feedly. I like this option with its simplistic user interface as well as the variety of options for saving and sharing content. When I was reading one of my RSS feeds, I came across an article about Spritz. This company has some great technology that is supposed to help with the number of words you can read in a minute as well as improve your comprehension. Being a former 1st grade teacher, I had to check this out. 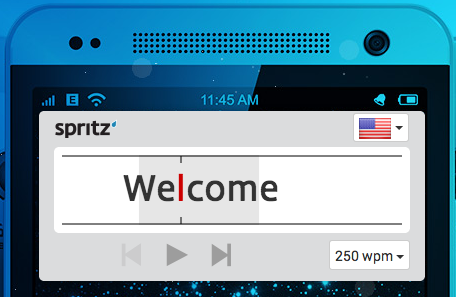 Using their technology, they eliminate the need to track words from left to right. They provide you one word at a time with a single letter in red to focus your eyes. You can choose the rate at which you would like the words to appear.  To use Spritz with your RSS feeds, you need to create a free account on The Old Reader. When you have completed this step, you can choose to import your current RSS feeds. Since I used Feedly, I was able to click "organize" and then scroll to the bottom where it gave me the option to "save as OPML." After I had exported all my subscriptions into the OPML format, I returned to my The Old Reader account and selected import. I then located my OPML file and presto! After giving a few minutes for all the subscriptions to update, I was able to go into The Old Reader settings and locate the option to enable Spritz. 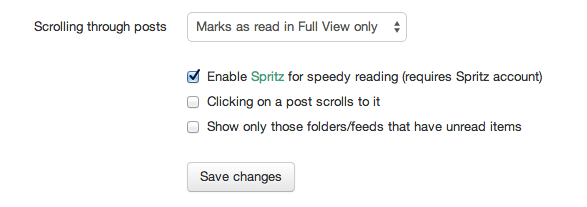 After enabling Spritz for speedy reading, I returned to my subscriptions and a "Spritz" button appeared at the top of each post in my feeds. By clicking on the "Spritz" button, my article was then presented to me using Spritz's technology. 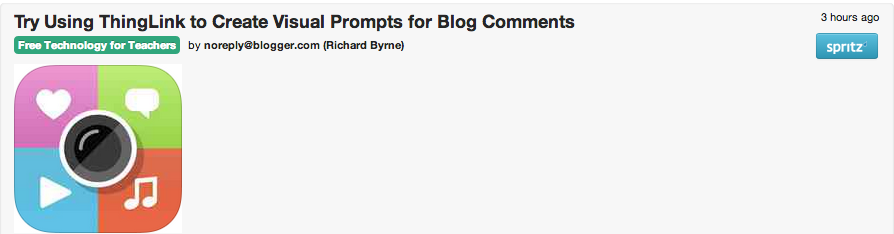 I haven't used this a ton yet but am looking forward to seeing how this works when reading through a plethora of RSS feeds. This will be interesting to see how this technology could be applied to the classroom setting. Share This:
**If you are unfamiliar with this project, check out my first post introducing my pilot project with LearnPads and comparing them to iPads. One challenge facing any teacher/building/district with tablets is establishing a workflow. How do I get material to students as well as get it back from them. Often times a cloud storage tool comes into play. Google Drive offers many scripts for creating and monitoring shared folders. This is great for GAFE schools, but what about non-GAFE schools? If you are lucky enough to have the newest version of the iPad, you are able to use AirDrop to quickly distribute work to your students. Furthermore, your students can use AirDrop to send the completed work back to the teacher. The pitfall of this is those schools that have older version of the iPad with no AirDrop. The LearnPad offers a very useful feature called Hand in/Hand out. While my class has been using Dropbox as the hub for our paperless workflow, we have been experimenting more and more with the Hand in/Hand out feature. Hand in/Hand OUt Below is an example of how quick and easy distributing work to students can be using the hand in/hand out feature. During our math class we were learning about number grid puzzles. Below is an example. 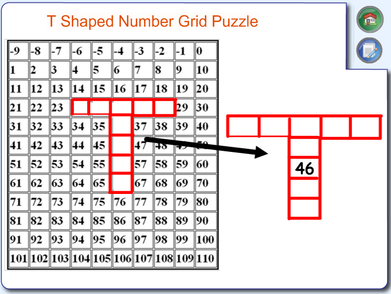 I modeled a few problems to demonstrate the connection between a puzzle you might do at home with mom/dad and a number grid puzzle. We talked about the number grid being the completed puzzle, but we had to fill in these funny shaped pieces with their missing numbers. After modeling a few, we did some together to practice applying our understanding of patterns on the number grids. My first graders were picking up on this new skill and needed some individual practice to check for understanding. I used the Windows snipping tool to quickly cut out only the puzzle pieces that I wanted from the slide below. Once snipped, I can save them as an image.  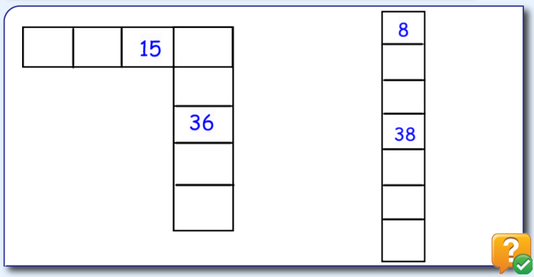 After I had snipped each number grid puzzle piece, I opened Word and created a new document. I inserted both snipped images into the document and then saved the Word document as a PDF file. I then opened up the LearnPad portal. From my dashboard view, I was able to select the devices that I wanted to send this PDF file for students to complete. This was especially nice since some students were absent. I was able to select only the tablets that were present that day. I clicked on "select a file to send" under the Hand Out option. A box appears to locate the file on your computer. Once you find and select the file, a progress bar is displayed to show the upload progress. In addition, you will see little paper icons shoot to each tablet icon in your dashboard letting you know that those tablets have received the file. A notification pops up on student tablets letting them know they have a new handout. They simply click the notification and the file automatically opens up in the annotation app for my students to annotate. 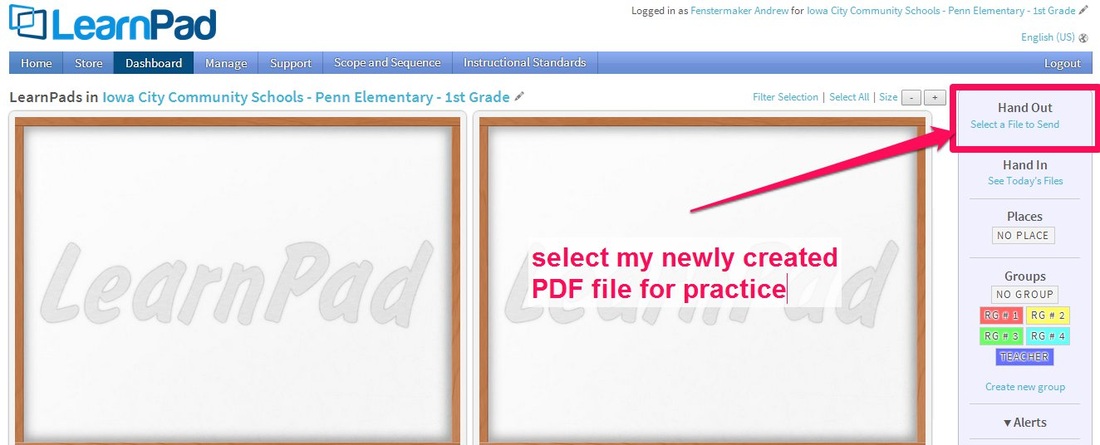 I would love to say that I always have everything printed or saved for students to work on. However, you never know when a teachable moment will arise. Since my students quickly grasped this new skill, I needed a quick informal assessment to determine if anyone was still struggling. Using the snipping tool, Word and the Hand out feature of the LearnPad, I was able to create and distribute an assessment in less than two minutes. One big reason I think the LearnPad stands out above the iPad with the workflow management is that you don't have to buy a brand new tablet to have this feature like you do if you want AirDrop on the iPad. Share This: |
Andrew FenstermakerInstructional Technology Coordinator | Innovation Coach | Google Certified Innovator | Presenter | Blogger | Adjunct @UiowaEducation | Owner @kids_f_i_r_s_t 


|


 RSS Feed
