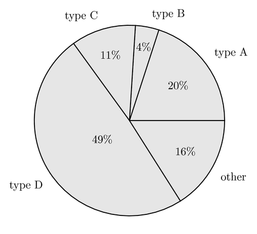
The Plan..... We had been studying how to turn data into pie charts or "percent circles." I had planned to have students take some data, add it into Google Sheets, create a pie chart, save their chart as an image, and create a Thinglink to add "tags" to the slices of the pie chart. The Data and Chart... Our community is home to The University of Iowa. With it being NCAA basketball season, we decided to use some statistics from theIowa men's basketball team. 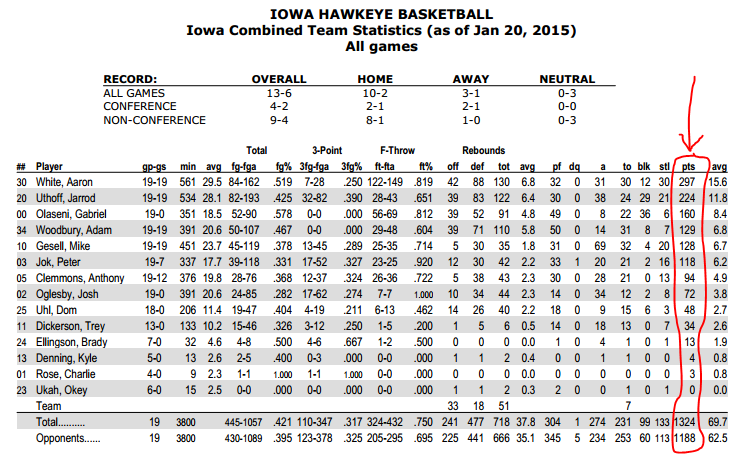 We started by looking at the total points scored by each player on the team. We took the data and put it into a Google Sheet. 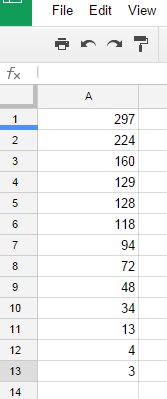 After the data was recorded in the Google Sheet, it was highlighted. After being highlighted, we clicked insert and chart. 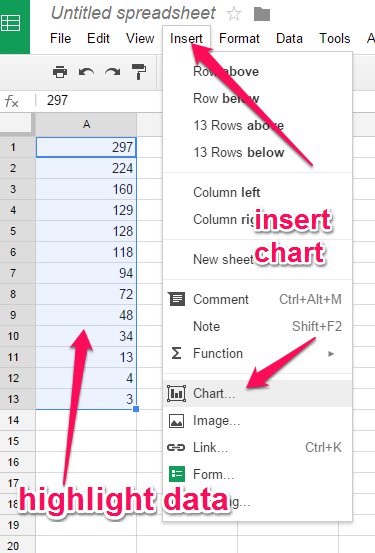 After selecting to insert chart, we selected "charts" and then we were able to choose "pie chart." 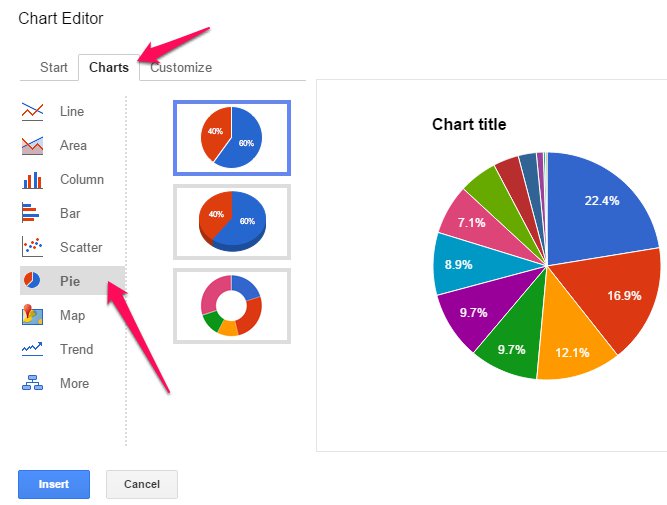 After the chart was chosen, we then clicked insert to get it into the Google Sheet. At this time, we took a screen shot of the pie chart. We saved the screen shot to our desktop for easy access. 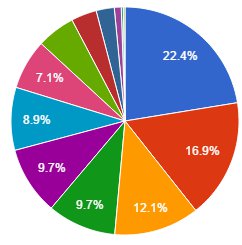 Thinglink... After our pie charts were saved to our desktops, we navigated to Thinglink. After signing into Thinglink, we clicked "create" to begin adding tags to our pie chart. 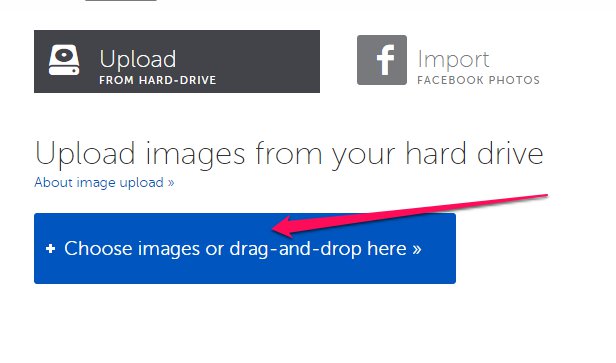 We chose to upload images. Students would select the image from their desktop. Once loaded in Thinglink, we gave our picture a title and added our first "tag." 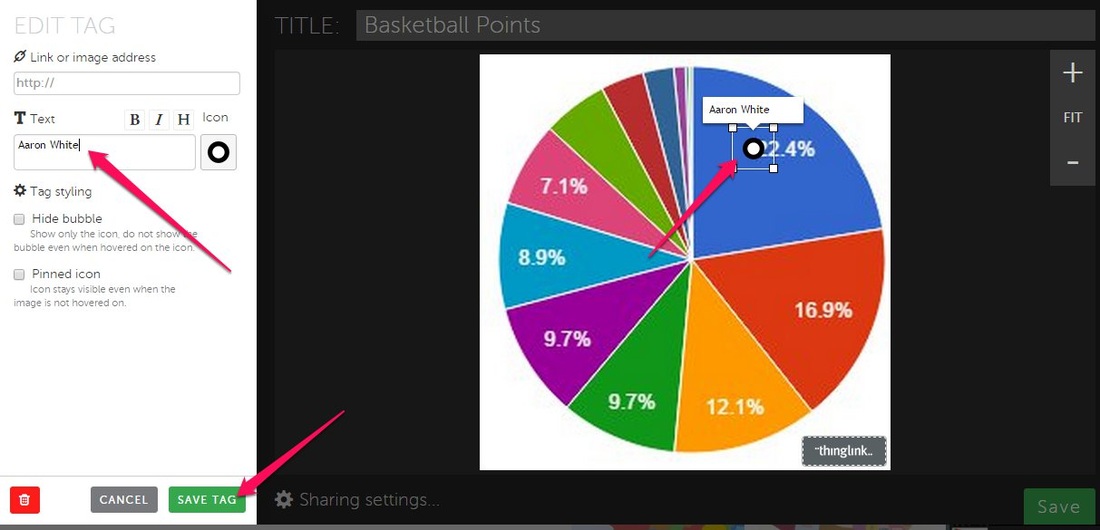 Students used the stats of the men's basketball team to correctly name the tags. Each tag was supposed to contain the name of the player who had scored that percent of the total points. This process was repeated for all slices in our pie chart. Upon completing their interactive image, they clicked share and copied the embed code. This embed code was then added to their Kidblog to share. The next step of this process was to look at more statistics from the men's basketball team. Take away... We could have done this same process using the provided data from the curriculum. However, to make this a more authentic experience, we chose to utilize some of the local information we had available. Students were able to make a connection with the data and knew almost all of the players. It was a fun way to practice pie charts in an authentic way. Share This:
1 Comment
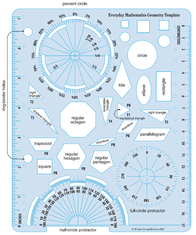
Once skill that is being practiced in fifth grade right now is creating pie charts. We have been talking about creating fractions, turning them into decimals, then into percents to create a pie chart using a template.  We used Poll Everywhere, SMART Notebook and our LearnPads to create an authentic experience for creating our own pie charts. Poll Everywhere To begin the activity, I create a total of five polls to have my class complete. I grouped them within the Poll Everywhere dashboard and labeled it as Pie Charts. 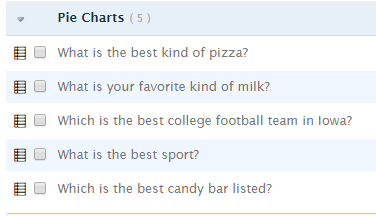 Students navigated to my custom URL to complete my polls. One of the five polls was displayed on the SMARTBoard while students completed the survey on their LearnPads. *Below is an image of what my students would see on their tablets. 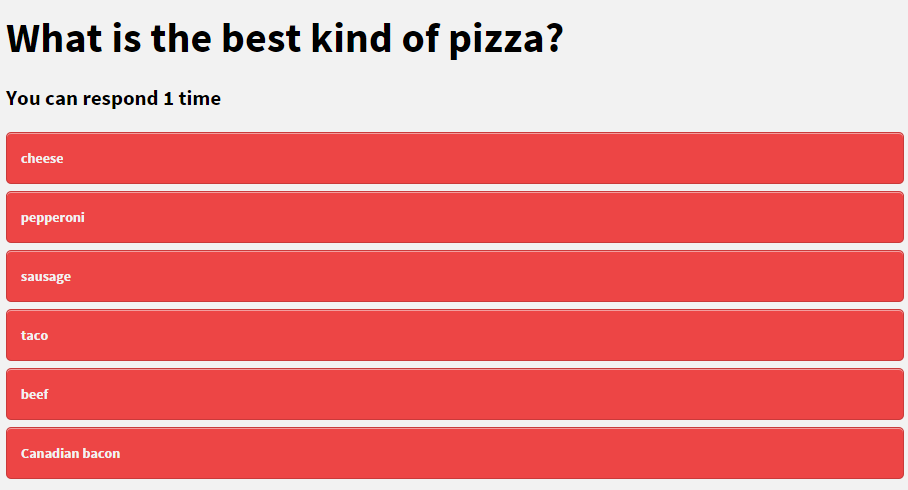 The students were able to see the results in real time as we took the poll. Once everyone in class had made a choice, I used the screen capture tool in my SMART Notebook software to snip the results and quickly put into a slide within SMART Notebook. 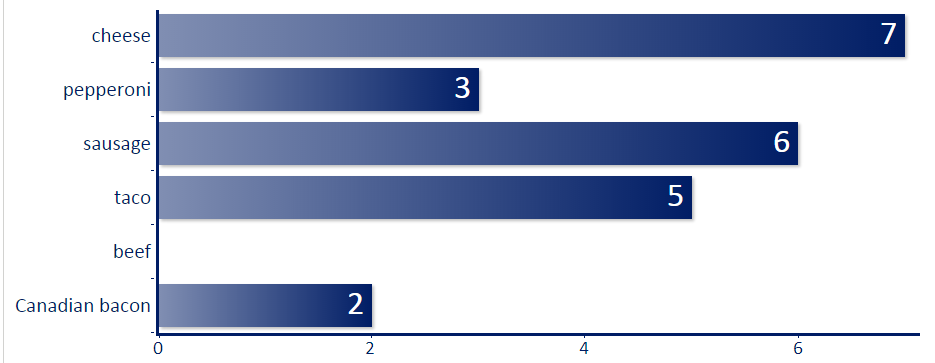 SMART Notebook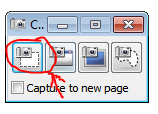 After using the snipping tool within SMART Notebook, I change the poll for students to continue completing all five of the polls. After each poll, I used the snipping tool to capture each result and put into the SMART Notebook software. 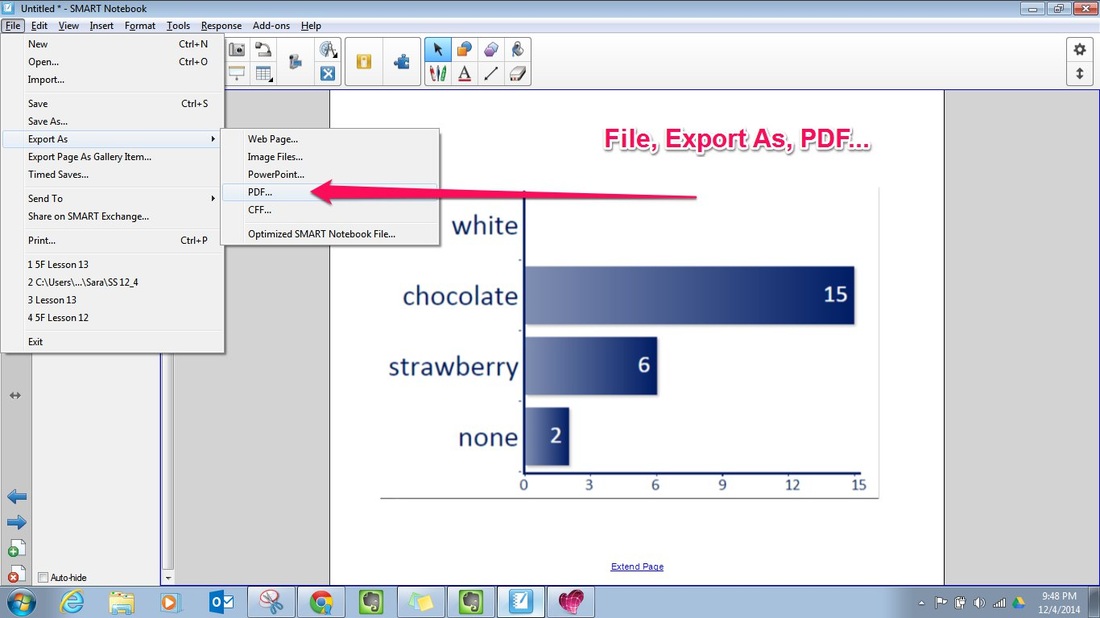 After all the polls were added into the SMART Notebook software, there is an option to export it as a PDF. This would be very similar to exporting a PowerPoint or Google Slideshow as a PDF. LearnPAD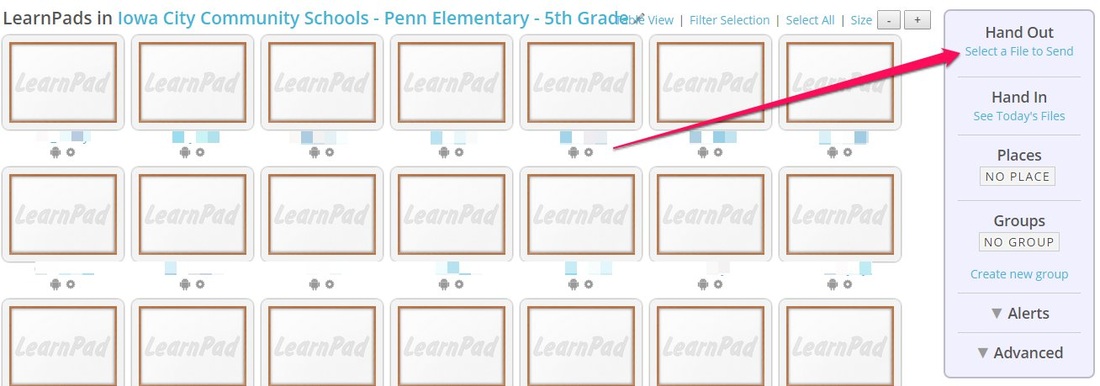 Once the file was exported to a PDF, I logged into my LearnPad Portal online. Within the dashboard, where I can see all my students' tablets, I have the option to "Hand out" a file. I selected the "Pie Chart" PDF file and it was automatically sent to all the students' LearnPads. This allowed all of them to access the PDF results on their LearnPads. Pie Charts To wrap up the assignment, students used the data gathered from the Poll Everywhere Polls to create their own pie charts. They used the template above to correctly divide their pie charts. They had to create fractions of the data, convert to decimals and then finally into percents. Once they had the percents, there were able to correctly divide their circles into the correct portions. The students really enjoyed the chance of creating their own data together using Poll Everywhere and then having the chance to turn it into pie charts. Share This:
**If you are unfamiliar with this project, check out my first post introducing my pilot project with LearnPads and comparing them to iPads. One challenge facing any teacher/building/district with tablets is establishing a workflow. How do I get material to students as well as get it back from them. Often times a cloud storage tool comes into play. Google Drive offers many scripts for creating and monitoring shared folders. This is great for GAFE schools, but what about non-GAFE schools? If you are lucky enough to have the newest version of the iPad, you are able to use AirDrop to quickly distribute work to your students. Furthermore, your students can use AirDrop to send the completed work back to the teacher. The pitfall of this is those schools that have older version of the iPad with no AirDrop. The LearnPad offers a very useful feature called Hand in/Hand out. While my class has been using Dropbox as the hub for our paperless workflow, we have been experimenting more and more with the Hand in/Hand out feature. Hand in/Hand OUt Below is an example of how quick and easy distributing work to students can be using the hand in/hand out feature. During our math class we were learning about number grid puzzles. Below is an example. 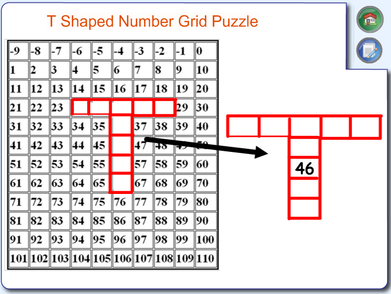 I modeled a few problems to demonstrate the connection between a puzzle you might do at home with mom/dad and a number grid puzzle. We talked about the number grid being the completed puzzle, but we had to fill in these funny shaped pieces with their missing numbers. After modeling a few, we did some together to practice applying our understanding of patterns on the number grids. My first graders were picking up on this new skill and needed some individual practice to check for understanding. I used the Windows snipping tool to quickly cut out only the puzzle pieces that I wanted from the slide below. Once snipped, I can save them as an image.  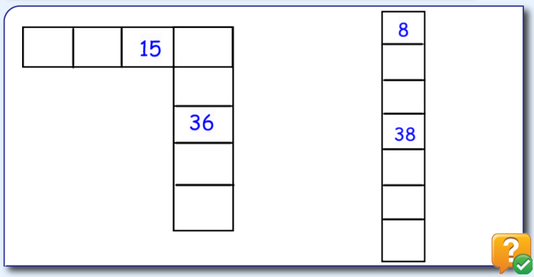 After I had snipped each number grid puzzle piece, I opened Word and created a new document. I inserted both snipped images into the document and then saved the Word document as a PDF file. I then opened up the LearnPad portal. From my dashboard view, I was able to select the devices that I wanted to send this PDF file for students to complete. This was especially nice since some students were absent. I was able to select only the tablets that were present that day. I clicked on "select a file to send" under the Hand Out option. A box appears to locate the file on your computer. Once you find and select the file, a progress bar is displayed to show the upload progress. In addition, you will see little paper icons shoot to each tablet icon in your dashboard letting you know that those tablets have received the file. A notification pops up on student tablets letting them know they have a new handout. They simply click the notification and the file automatically opens up in the annotation app for my students to annotate. 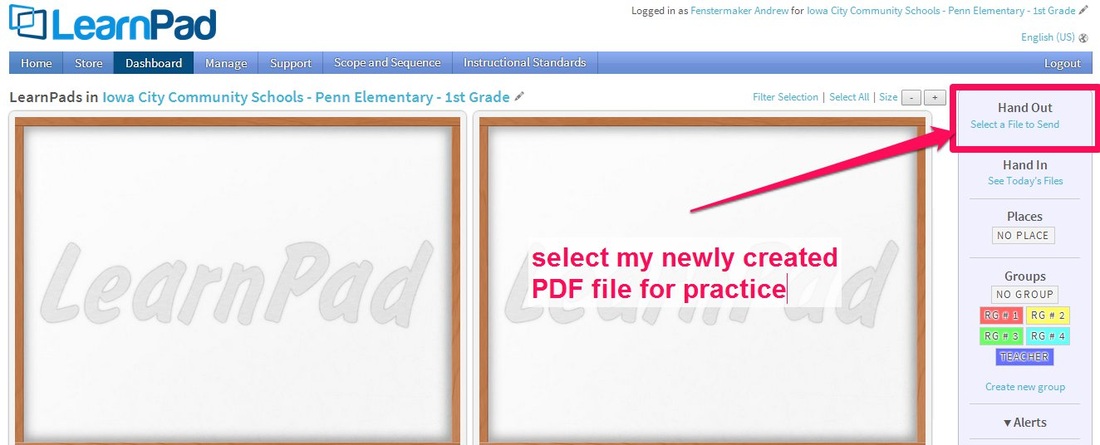 I would love to say that I always have everything printed or saved for students to work on. However, you never know when a teachable moment will arise. Since my students quickly grasped this new skill, I needed a quick informal assessment to determine if anyone was still struggling. Using the snipping tool, Word and the Hand out feature of the LearnPad, I was able to create and distribute an assessment in less than two minutes. One big reason I think the LearnPad stands out above the iPad with the workflow management is that you don't have to buy a brand new tablet to have this feature like you do if you want AirDrop on the iPad. Share This:
**If you are unfamiliar with this project, check out my first post introducing my pilot project with LearnPads and comparing them to iPads. In first grade we have been learning about attribute rules with 2-D shapes. We began our lesson exploring and reviewing different 2-D shapes. We practiced identifying the different attributes of each shape. After a quick review, we began working together to sort shapes based on an attribute rule (all red shapes, all squares, only triangles, etc.). This led to having shapes already sorted and working to identify the "mystery" attribute rule. This is where the LearnPad/iPad got integrated into the lesson. In an attempt to have my students apply their learning while creating and collaborating, we sorted shapes on our tablets. After sorting these shapes into two categories, students wrote "rule" above the side with their "mystery" rule. This final product was posted to their blog. After posting to the blog, students were able to leave comments with their guesses about the attribute rule being represented by the posted image. This was helping us work towards CCSS 1.G.A "Reason with shapes and their attributes." Below is a video that highlights how this activity was done in my class as well as how it can be done on both LearnPads and iPads. Below are some screenshots of a final product that was posted online. You can see the rest of the post by clicking here. 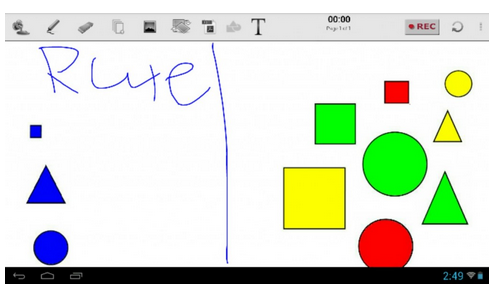 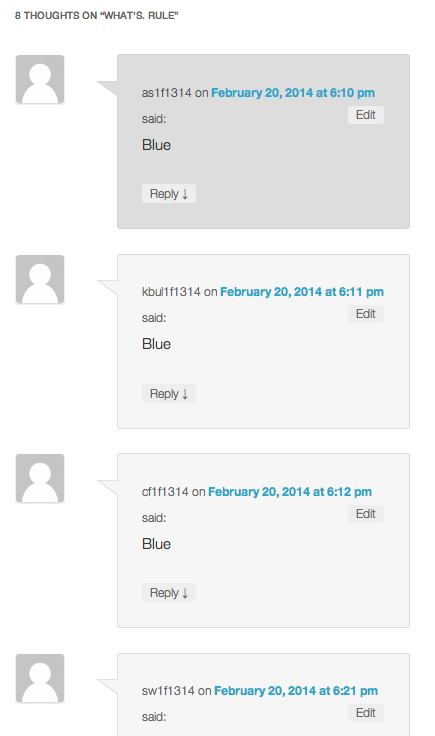 Share This:
**If you are unfamiliar with this project, check out my first post introducing my pilot project with LearnPads and comparing them to iPads. In first grade we have been learning how to tell time throughout the school year. We started with time to the hour, moved to half hours and then went to quarter hours. Our most recent adventure took us to writing the digital time represented on analog clocks. The activity that we did can be done on both the LearnPad and the iPad. While the apps used to complete this activity were different, the end result turned out the same. In an attempt to have my students apply their learning while creating and collaborating, we annotated a time on an analog clock and posted it to a blog. Having students annotate a time on an analog clock required them to apply their understanding of Common Core Standard 1.MD.B.3 which requires 1st graders to tell and write time in hours and half-hours using analog/digital clocks. To add an additional layer to this activity, students then went to their peers' blog posts and left a comment with the digital time that the analog clock was representing. Below is a video that highlights how this activity was done in my class as well as how it can be done on both LearnPads and iPads. Below is a few screen shots from a students final product posted on the blog. You can see the rest of the post by clicking here. 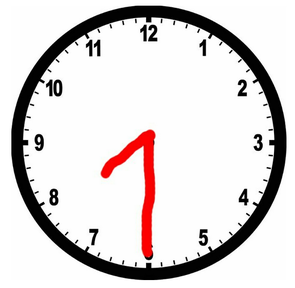 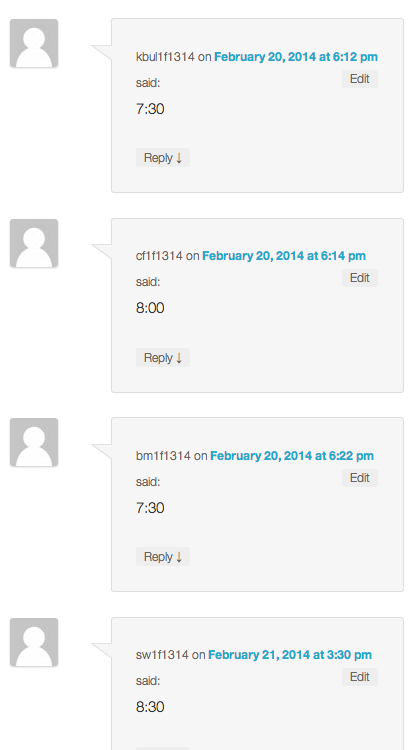 Share This: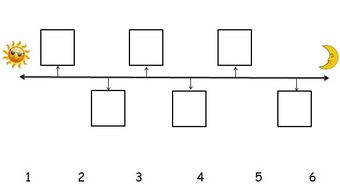
My 1st graders used the iPads to check their understanding of timelines. We had been exploring timelines in a recent math lesson and I wanted my students to practice arranging events on a timeline. In order for my students to relate to the events, we practiced placing events from a typical day at school in the correct sequence. There were a total of six events that needed to be placed into the correct box on our makeshift timeline. There was a sun placed a the beginning to represent morning and a moon at the end to represent night. It was up to the students to place the number in the correct box. Below are the steps I used to create this activity. Timeline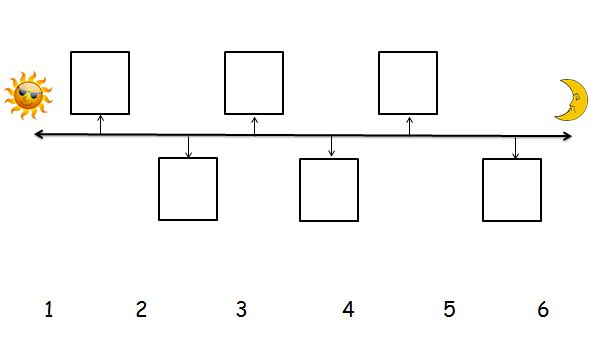
I used Microsoft Word to create my timeline worksheet. I added a sun at the beginning and a moon to the end. The numbers at the bottom were for students to cross out as they began writing numbers in the boxes. This was to help alleviate scanning the same QR code over and over. QR Codes
I used the website QR Voice to create my QR Codes. This is a site that you type the text into the box. QR Voice automatically generates a QR code. When this QR Code is scanned, the text that you typed is read aloud to the person who scanned it. While I could have used a QR code that would simply display text only, I chose QR Voice to help with my students that are transitioning to independent readers. 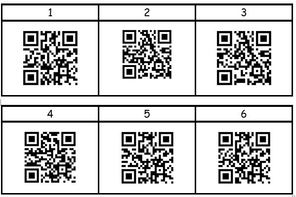
Above are the QR codes that I created using QR Voice. I put them into a table in the same file that I created my timeline worksheet. I was able to print these, cut them out and tape them up around the classroom. *Make sure to leave the number with the QR code so the students know which "event" is associated with each number. Events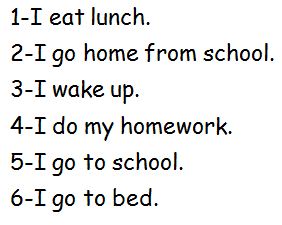
Above are the events from our typical school day. You can see that the numbers next to each event are not in the correct order. I told students when putting numbers in the boxes on the timeline that they would not just put 1,2,3,4,5,6. ActivityStudents would use the Qrafter app on the iPad to scan a QR code. Once scanned, the "event" would be read aloud to the student. For example, if QR code with the number one above it was scanned, the student would hear, "I eat lunch." It was the students' job to place the numbers in the correct box on the timeline. ReflectionThe students really did a good job with this activity. It required them to keep track of the events that they heard and place them in the correct order. Some students even wrote the "event" sentence next to each number on their worksheet before starting to place numbers into the timeline boxes. Problem solving in action. Love it.
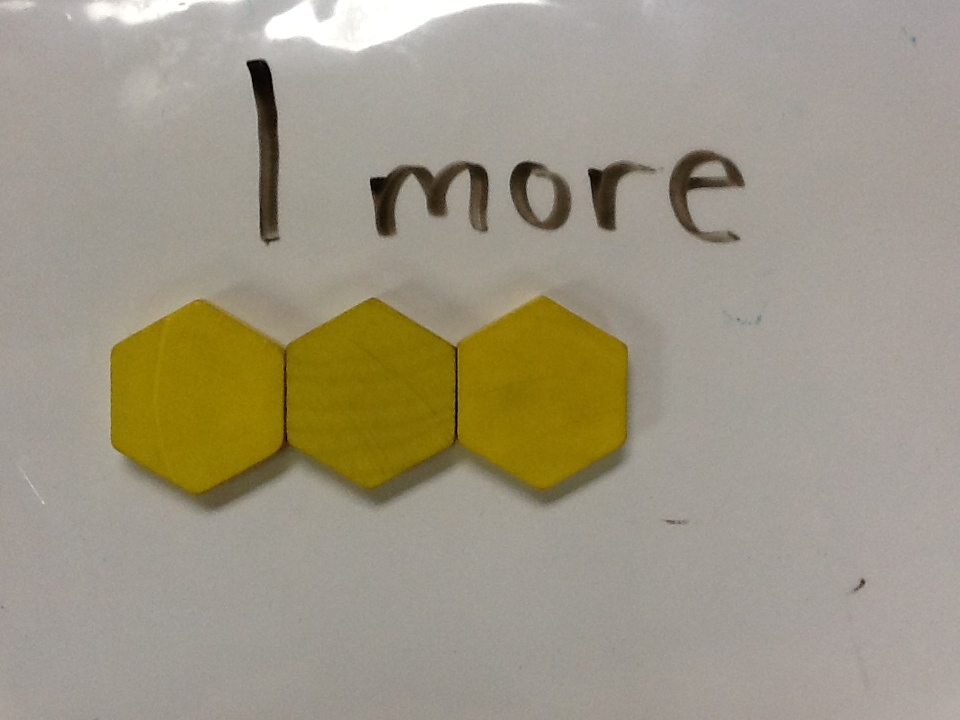
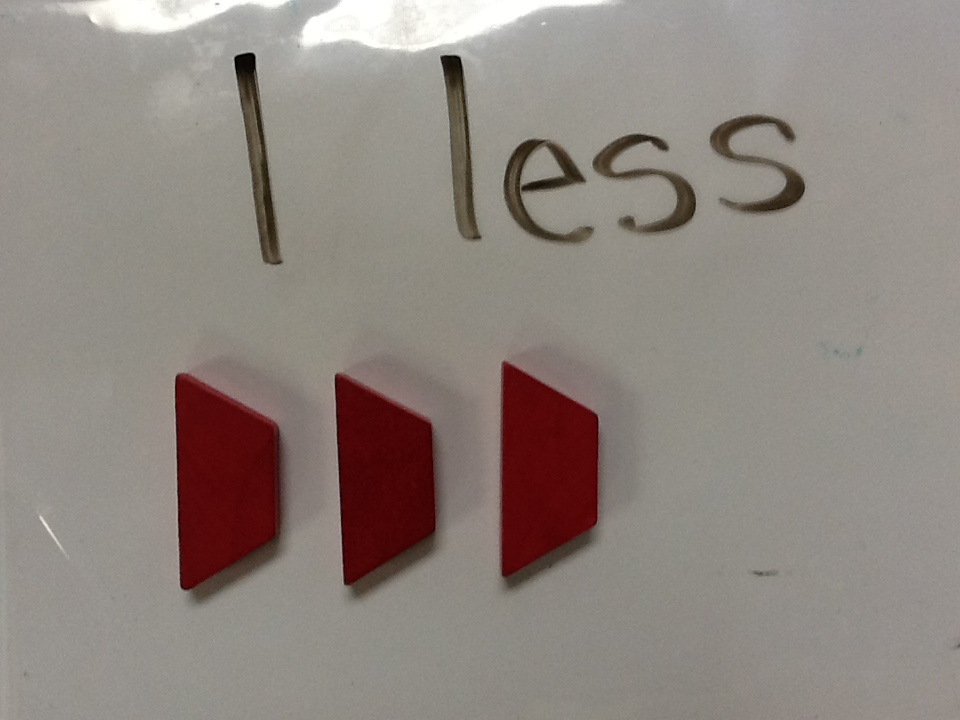
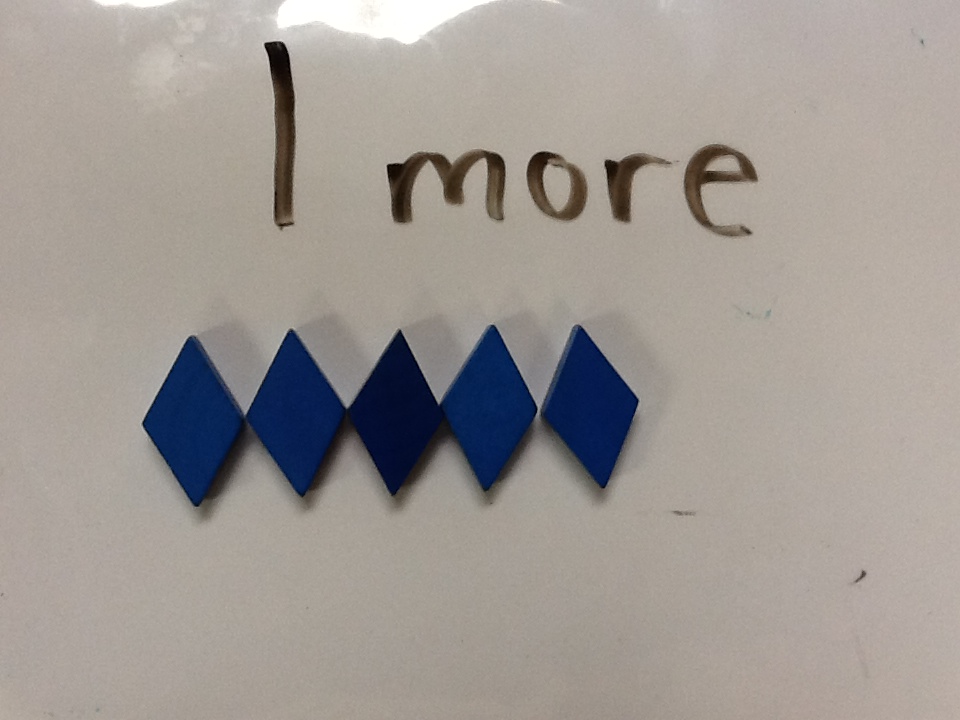
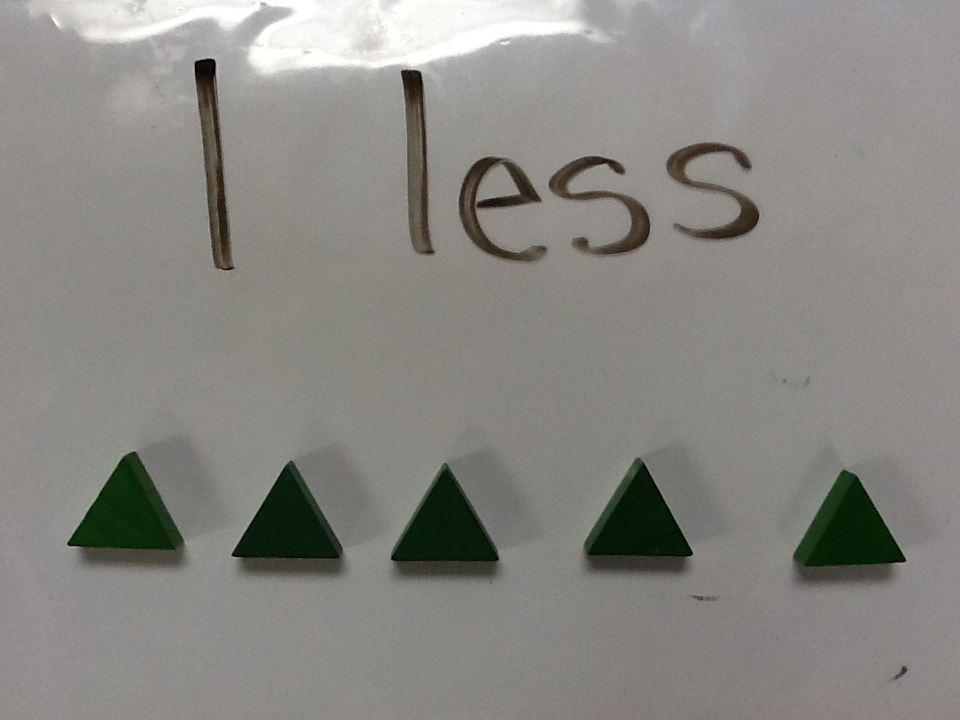
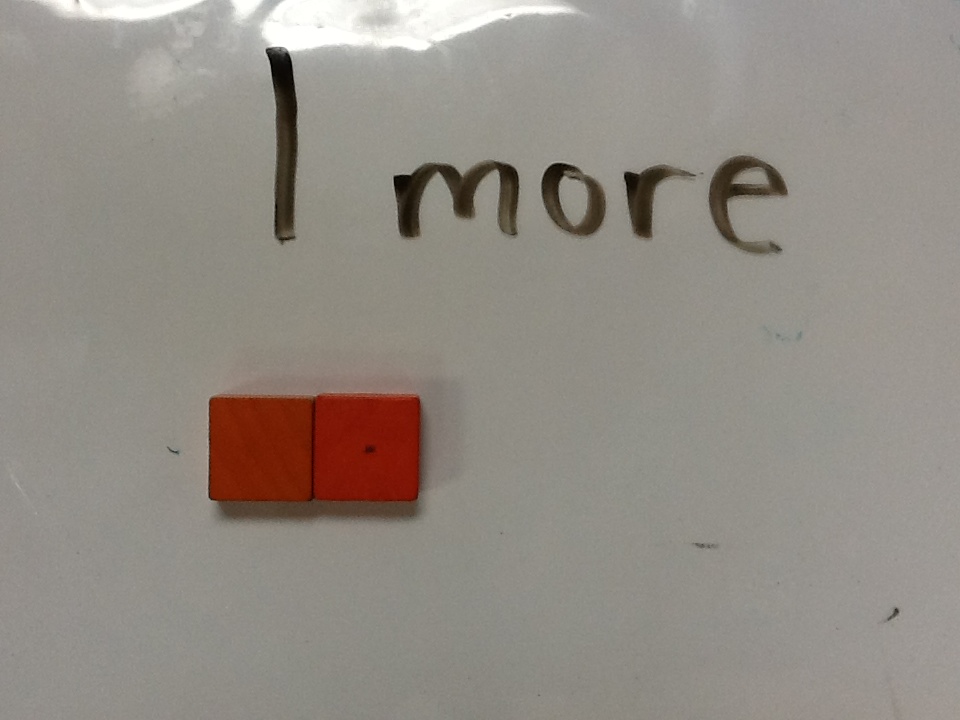
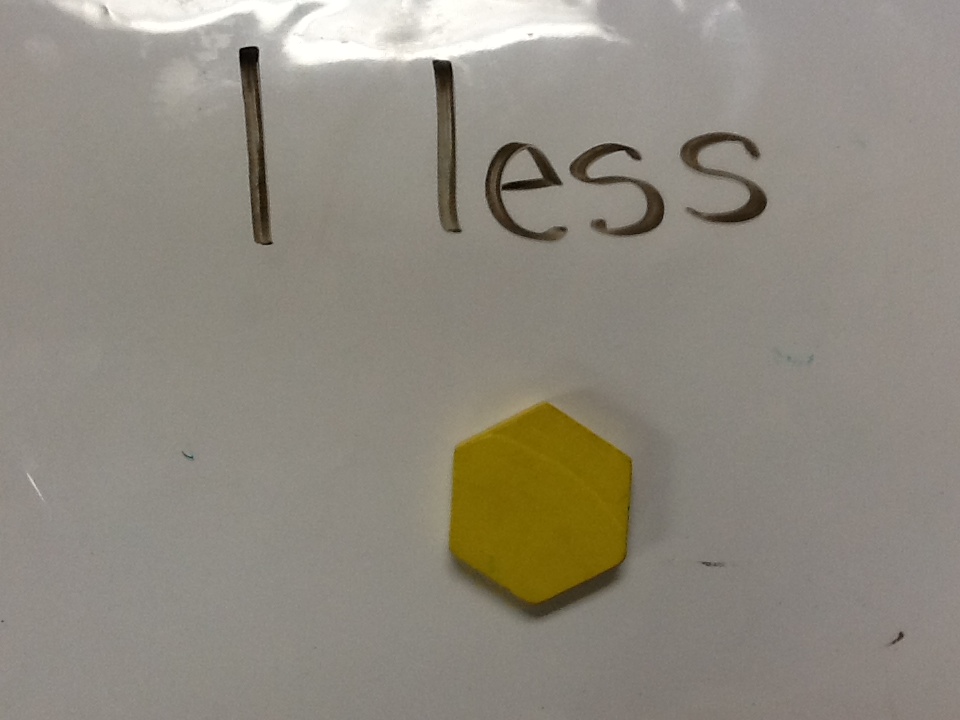
TWEAK Students could use the Educreations app to snap a picture of the timeline worksheet. They could then annotate over the picture writing the numbers in the boxes with digital ink. When they completed the timeline worksheet via Educreations, they could embed the video onto their blog or send the link to the teacher to check their work.  During our reading rotations today, students used the Educreations app on the iPads to model 1 more or 1 less. This was to provide some practice with our math lesson from yesterday. In math we had talked about and practiced problems with 1 more and 1 less. 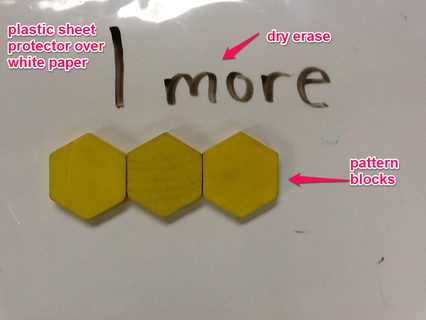 To get this set up this morning I began by taking some pictures with my iPad. I have little tubs of pattern blocks that I planned to have students use for this activity. Using a dry erase marker, some pattern blocks and a slate (white paper with plastic sheet protector) I created a total of six problems for students to complete using the Educreations app. Below are the six problems I created using my iPad.
I took these 6 images and uploaded them to a shared folder in my Dropbox app. I have my own personal Dropbox account and I created one generic Dropbox account that my student iPads are signed into. Since I have a shared folder, I can put items into it and those items will automatically show up on the student iPads. This saves me from having to load the pictures onto each iPad individually. **In the picture below you can see that each picture was labeled for it's corresponding page. This helped students know which picture to put on which page in Educreations. 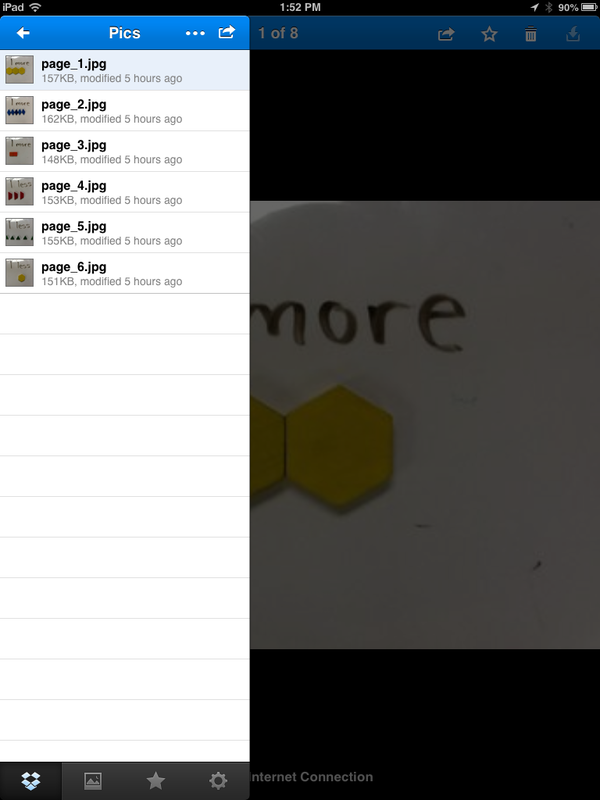 After I had all the pictures in the shared folder, my work was done. All that was left was explaining the steps to my students. Below is what I explained to students for completing this task. If the presentation doesn't load try clicking here. What I learned **I got my iPads for my students in the spring of last school year. I got spoiled by my 1st graders being able to follow multiple step directions and being more independent.
Just as we encourage students to fail and learn from their mistakes, today was an epic failure on my part. After modeling and modeling again about the Educreations app and what I wanted students to do, it was one hot mess. "What do I do again?" "How do I add a picture?" "Where do I press to record?" "How do I get a new page?" "How do I save?" I now know what my students feel like when something doesn't work that they tried so hard to master! As with all technology in the classroom, you have to take risks and learn what will work. We will be revisiting this assignment and I will be remember to---KISS (keep it simple stupid). My goal tomorrow will be to require only one picture inserted, recorded and saved. The following day we will require two pictures. While I felt like a failure, check out this student sample for what I was hoping to accomplish. |
Andrew FenstermakerInstructional Technology Coordinator | Innovation Coach | Google Certified Innovator | Presenter | Blogger | Adjunct @UiowaEducation | Owner @kids_f_i_r_s_t 


|


 RSS Feed
