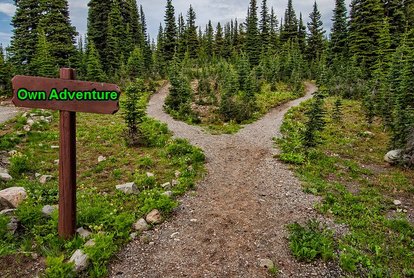
 The Template For a recent writing project, we had 5th graders complete a "Choose Your Owen Adventure" story using Google Forms. We chose to use Google Forms for a couple reasons. 1) We are a GAFE district which means each student has his/her own Google Account. 2) Google Forms provides a simple structure for adding text, images, pages and linking between pages based on answers. To get the project started, I created a story map (flow chart) to assist with getting ideas on paper. In addition, this story map provided specifics for which page each question/answer should link to during their story. When I created this story map, I allowed for two different levels of difficulty. Both of these options are provided in the example below which you can download and use as you would like. Feel free to tweak it and make it your own. Beginner Format To use the beginner format, you will need pages 1 and 2 from the story map template listed above. This format provides a total of 15 pages in your Google Form. Below is an example of how you could lay out the papers in the beginner format to visually assist with the flow from one level of your story to the next. 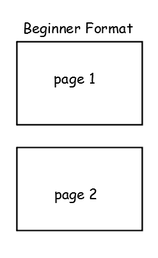 Challenge Format You will still need page 1 of the story map template. However, you will add in pages 3, 4 and 5 as well. The challenge format ends up with a total of 31 pages in your Google Form. Below is an example of how you could lay out the papers in the challenge format to visually assist with the flow from one level of your story to the next. 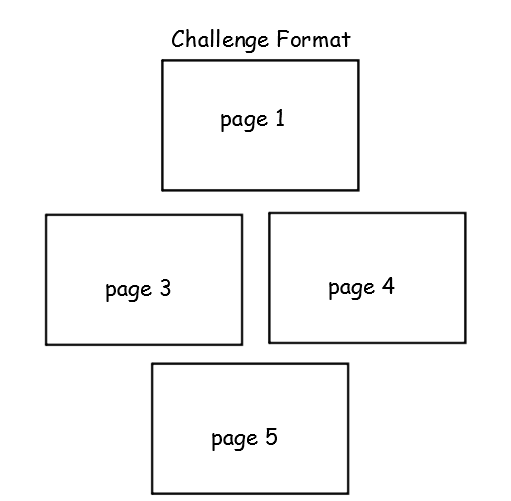 Our 5th Grade Results The 5th grade students used the beginner format to complete their Choose Your Own Adventure stories. We broke this into four different sessions. Session 1: A completed story was demonstrated for students to see the final product. The beginner story map was provided to students. They began mapping out their story. Session 2: A Google Form was introduced to students. Adding pages was demonstrated after creating a new form. Students could finish their story map and move onto creating a Google Form. Their main goal was to create a Google Form that had 15 pages. We labeled pages 2 through 15 as follows: page 2, page 3, page 4, etc. Session 3: Students were introduced to adding multiple choice questions to each page of their form. In addition, they were shown how to link to specific pages based on answers. Students spent time during this session, adding their text from their story map to the correct page in their Google Form. We had students link to the correct pages as they created their multiple choice question for each page. **Some students benefited from adding their questions to all pages first. After finishing all pages, they went back and linked. They were frustrated with creating questions and linking at the same time. Allowing them to type their questions and then go back and link alleviated that frustration. Session 4: We introduced students to adding images to each of their pages in their story. In addition, we modeled how to view their live form, copy their live form's URL and submit it to me via a Google Form that I had created. Students spent this session adding images and then submitting their final story's link to me. 5th Grade Choose Your Own Adventure Website To conclude this project, I took all the links that were submitted to me and added them to a Google Site. We originally talked about turning each Choose Your Own Adventure story into a QR Code and allowing students to scan and try out each other's stories. In the end, we went with a Google Site that students could navigate at school or home and try out each of their classmate's stories.
Choose Your Own Adventure Google Site
3 Comments
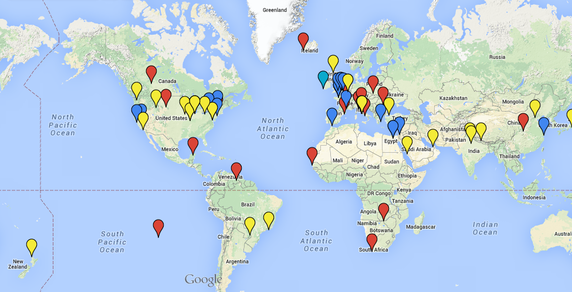 We recently completed a research project with all three fifth grade classes at my school. During this project, students got to pick a landmark to research. After picking a landmark, they used a template to begin filling out information. The template was laid out in a specific grid to match a Pic Monkey Collage we used later in this process. Once students had recorded all their information in the grid, they were then required to find an image for each cell in the grid that best represented the information in that cell. Students used Pic Monkey to create a collage of their images they had found for each cell in their grid. This picture collage was uploaded into Thinglink to begin adding "tags" to their collage. Each photo of their collage had a "tag" added to it with the corresponding information from the cell on their grid template. After all the "tags" had been added, students then copied their Thinglink URL, opened up a shared map, searched for their landmark and added their landmark to the Google Map. They were then able to add their Thinglink URL to their landmark location. To conclude, each student was recorded giving his/her speech about their landmark. This speech was uploaded to YouTube. The URL for their YouTube speech was copied by students and added on the Google Map to their landmark. The final result was a single Google Map with a landmark represented for each student's research. Each landmark had a Thinglink URL and a YouTube URL. Below are more detailed steps of the process for this project. Landmarks We used this website for students to choose their landmarks. Students started by exploring the list of 100 landmarks. They chose their top five landmarks. We then went one by one and had students select a landmark. We did this so we would not have duplicates of the same landmark. They were allowed to search the internet to answer the questions on the Landmark Research Template. They did use TripAdvisor to determine the landmark's rating as well as the average price of activities to do at the landmark. Pic Monkey I created a Symbaloo Mix for students to use when searching for images that they had rights to use in their project. However, we still had some students that didn't filter Google or Bing results based on license. When they published their ThingLink, it would not display because of using copyrighted images. It was a good lesson for students to see why we stressed using pictures that they had permission to use. 1) After pictures were found, students went to PicMonkey. They clicked on collage to build their collage.  2) After adding the images from their computers, they had to change the layout of the collage. To do this, they had to click the layout icon like the picture below. 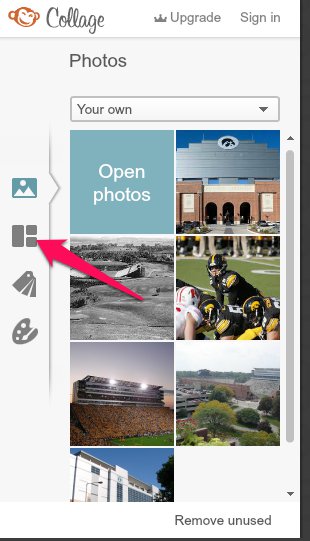 3) After selecting the layout option, they clicked "cards," changed the layout to 6 x 8 and then chose the last option to the right like the image below. *This layout was chosen because it matched out Landmark Research template that students had used to record their information. This was set up this way to assist with easily adding "tags" during the Thinglink step. 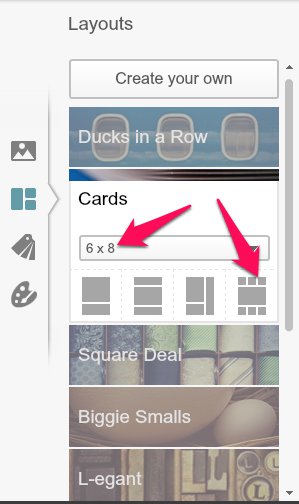 4) After changing to the correct layout, they just had to drag and drop their images into the correct cell of the grid. Once done adding images, they clicked save at the top. 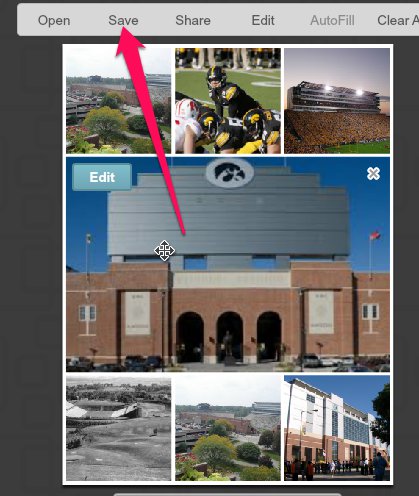 5) After clicking save, they are given the option to rename their image and specify the save location. We saved all our images to Google Drive during this project. 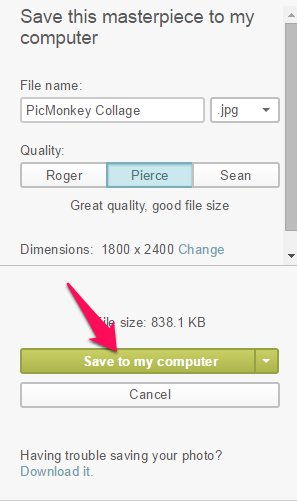 Thinglink Prior to this project, I had purchased a license to Thinglink. It was $35, but provided some nice features for using it with 75ish 5th graders. 1) The first thing students did after logging into their account was click create.  2) Next students had to click the big blue button to be able to select their pic collage they had made using PicMonkey. 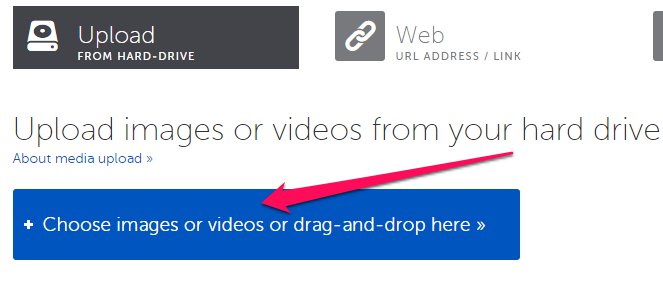 3) After their image was loaded, they were able to rename their Thinglink image and begin adding tags. 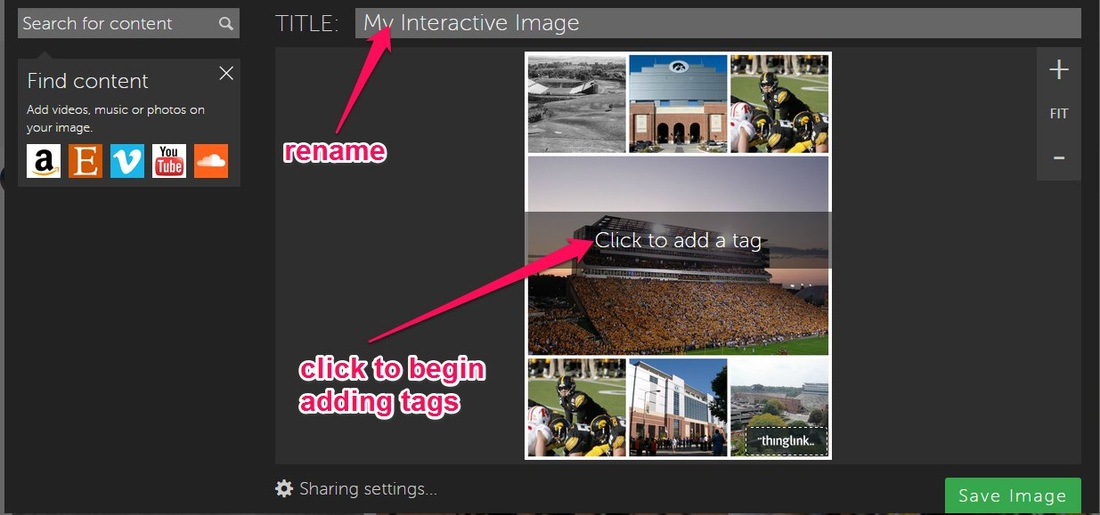 4) When adding a tag, they had the option to put in a URL or they could simply type in text that would be visible when the tag was hovered over by the mouse. We had students type in text. The text was the information they had recorded from their Landmark Research template. 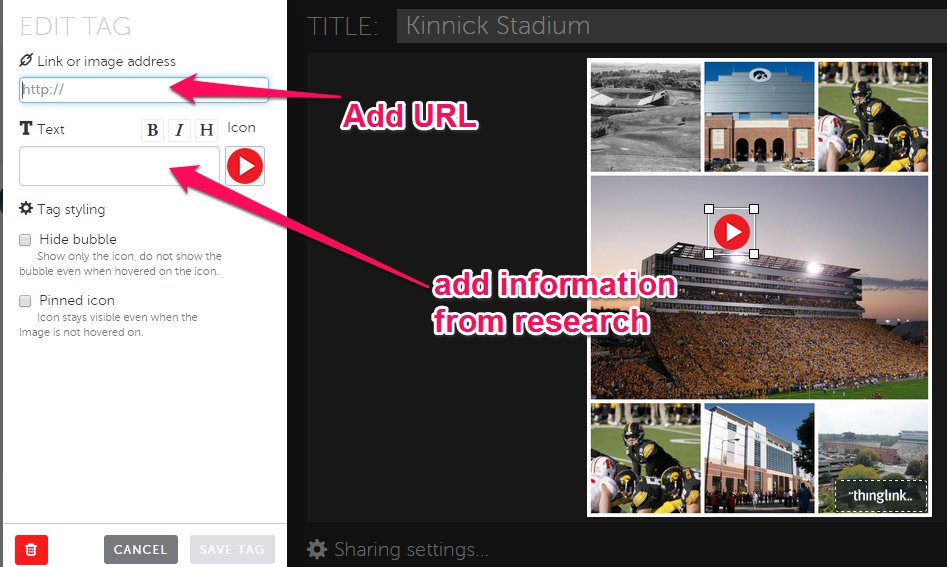 5) After adding all their tags, students were able to save their Thinglink image by clicking the green save button. 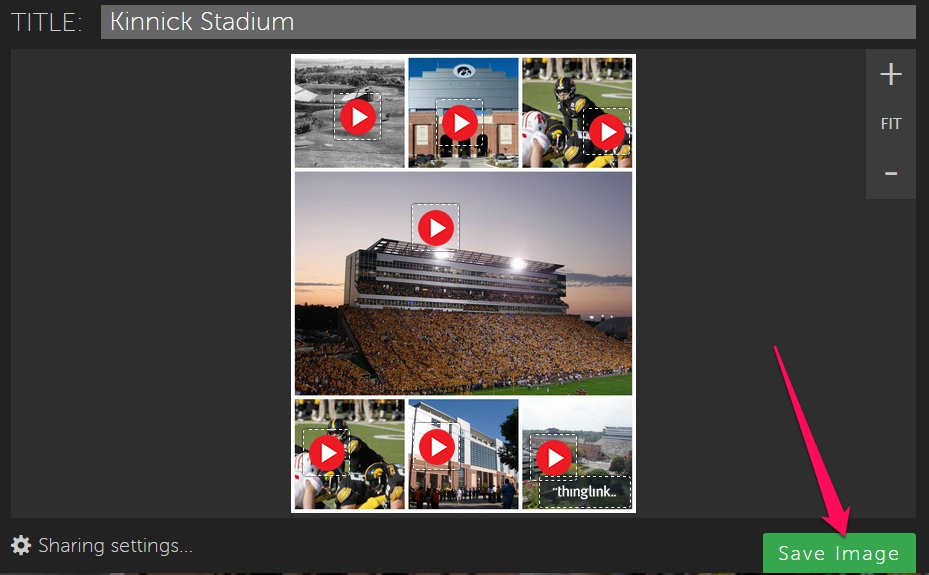 6) After saving their Thinglink image, they were able to click the share button. This provided them with multiple options for sharing. We chose to have students copy the URL to add to our shared Google Map. 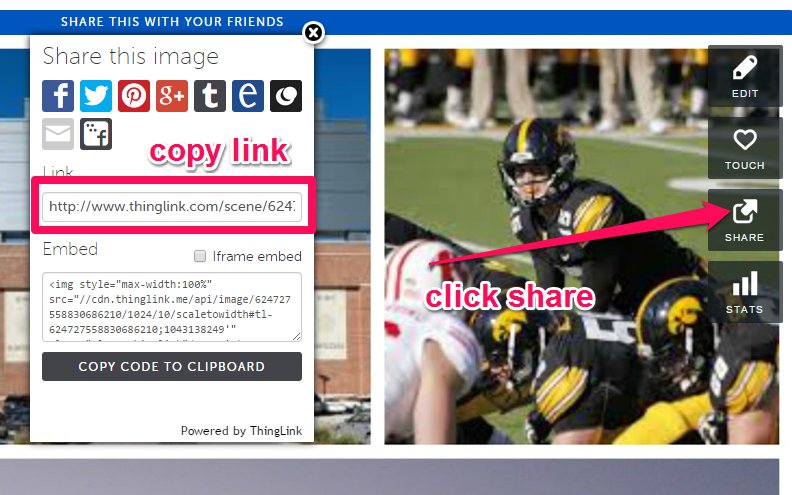 Google Maps Prior to students adding their links to a shared Google Map, I had to set up some of the basics of the map. 1) I first had to go to maps.google.com and click in the search bar. Make sure you are signed into Google which should give you the option for "my maps." After clicking my maps, you should have the option to "create" a new map. 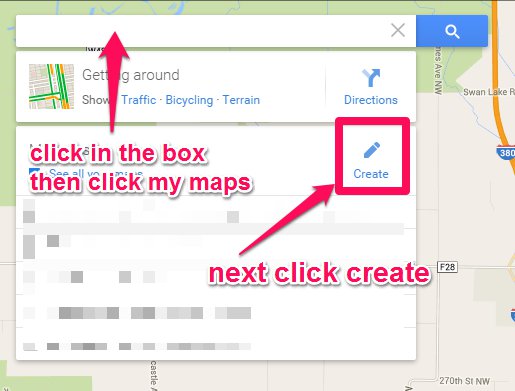 2) At this point you can rename your map as well as your first layer. 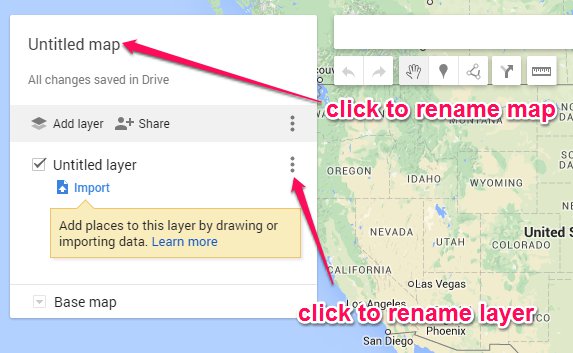 3) After renaming the map and layer, click the three dots on the newly renamed "layer" and choose to "open the data table. 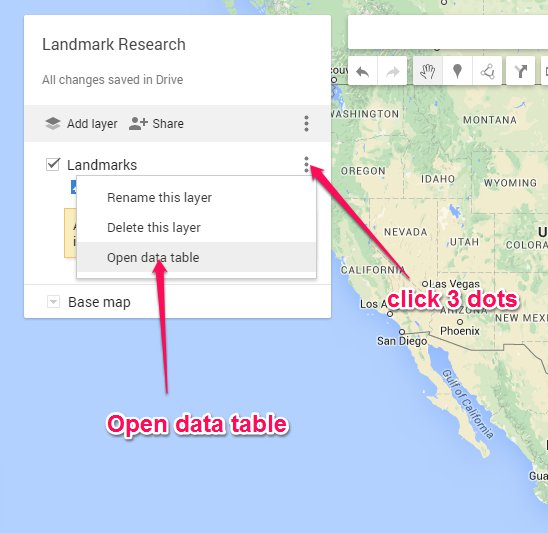 4) After opening the data table, you need to add a couple new columns. You can click the drop down arrow and choose to insert a column before or after. 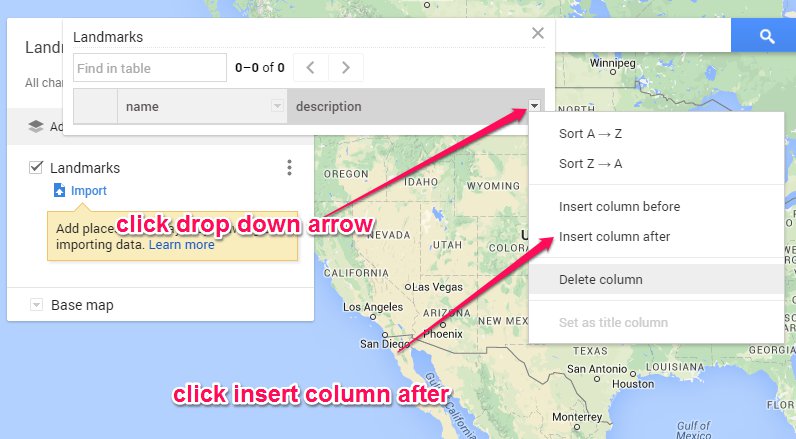 5) We added a Thinglink and YouTube column. We deleted the description column. 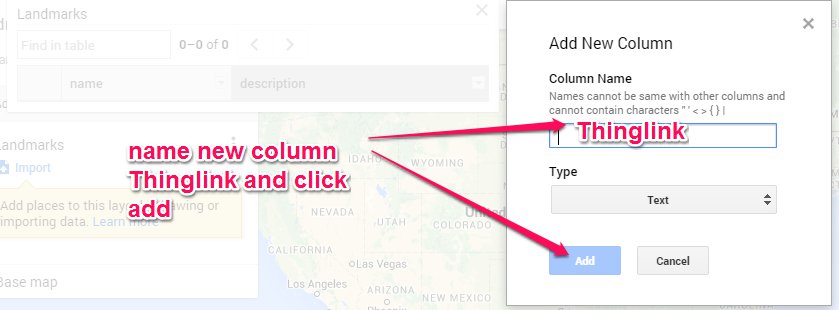 6) After adding the columns, you should be able to see the columns you will have being displayed in your "data table." 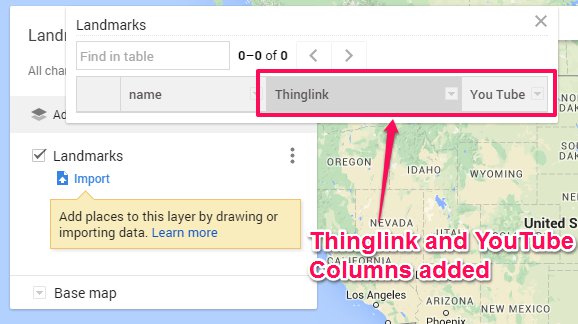 7) Once you have the data table all set up, you can share the map so your students can begin adding their landmark research. To do this, click the share button. 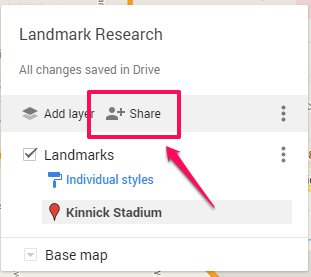 8) We set the link so that anyone who had the link could edit. The link that was provided was then shared with students. We shared it in Google Classroom so it was easy to access the map. After the map was finished, we went back in and set the sharing options to "view" only instead of editing. That made it so we could share the map with the world and not worry about someone being able to edit the map. 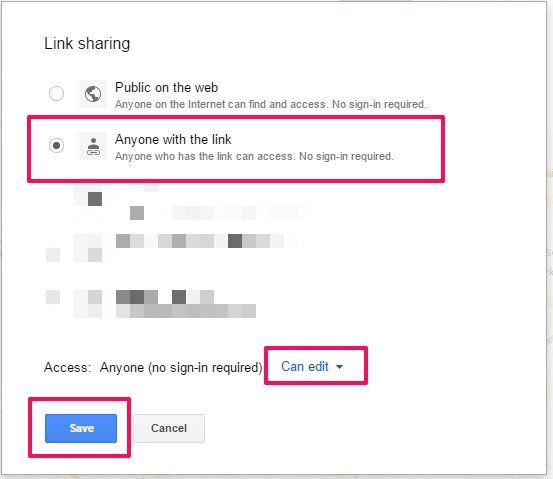 9) After sharing the map with students, they can click in the search bar at the top and search for their landmark. After their landmark is located, they can click on the green icon. This will allow them to click "add to map." 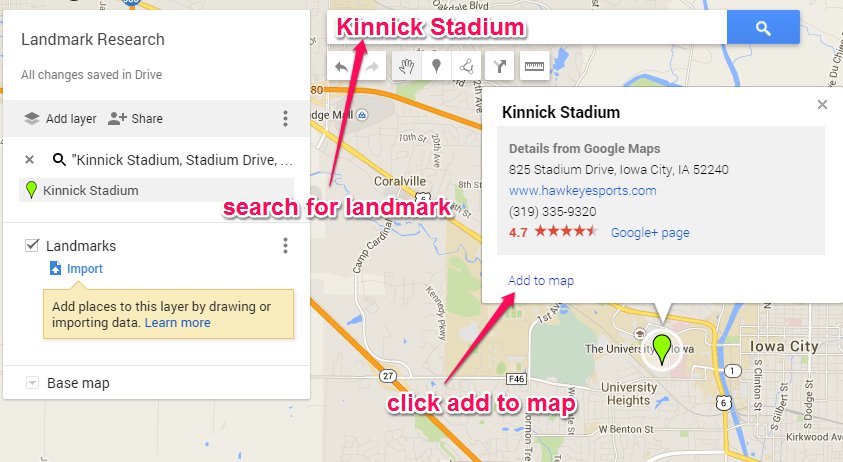 10) Once their landmark is added to the map, they will have the option to click a pencil on their landmark. This will allow them to edit the Thinglink and You Tube fields. Students can add in their links for both Thinglink and YouTube. Once done adding those URLs, they can click save. Their landmark is now added to the map. 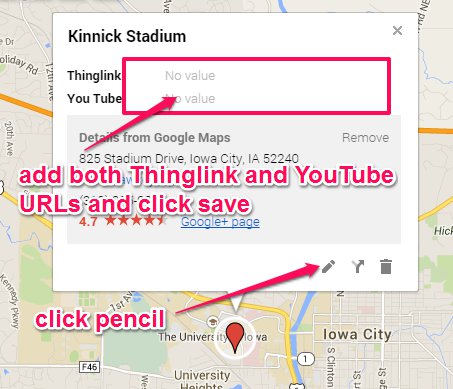 Changes This project was rushed a little faster than we would have liked. One of the 5th grade classes was piloting some Chromebooks so we had to finish this project before the Chromebooks went away. Looking back on this project, we would have liked to have students cite their sources and add a bibliography to either their Thinglink or their landmark on the Google Map. In addition, more time spent on finding images that students were allowed to use would have reinforced copyright laws. Lastly, after doing this project, we talked about doing some green screen movie making for their speeches. Having an image of their landmark as the background as they were doing their speech would have made their speech come to life even more. Share This: Recently we began studying about early colonies in social studies class. In an attempt to make the study more interactive and engaging, we utilized Google Maps to create our own maps. Not only did the students mark some of the colonies, but they were able to add their own information to each place marker they added to their maps. This idea was initiated while attending the ITEC conference in October. I attended a Google Map making session presented by Jim Sill. I didn't know how making Google Maps would apply to my own classroom, but I had heard great things about him and decided to attend. It was a game changer for sure. You can see an example of the final maps here. I will outline the steps of this process below. My students really enjoyed this activity. It really helped them connect with current day United States and where colonies were established hundreds of years ago. The Map Making process Step 1: You will need to visit maps.google.com We are a GAFE so all my students were logged into their Google Accounts when navigating to maps.google.com Step 2: Click into the map search bar and you will be given the option "My maps". 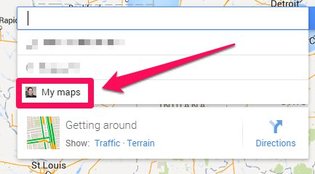 Step 3: Click create to begin creating your own map 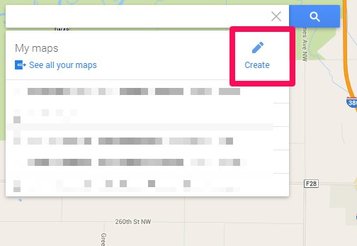 Step 4: Rename your map and rename your first layer according to your project. We renamed our first layer to "Early Settlements." 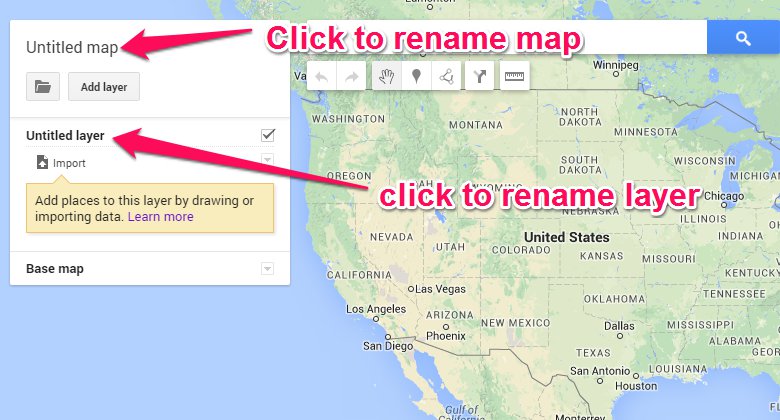 Step 5: Type the name of your first location you want to add to your map by typing its name in the Google Map search bar at the top of your map. You can then choose to add the location to your map. 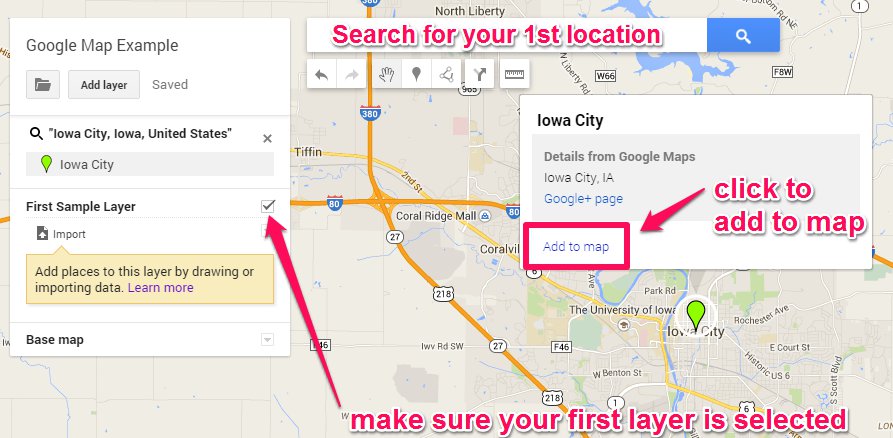 Step 6: After you have added one location to your first layer, you should now have a "data" option for your first layer. Select this "data" option to change your data fields. 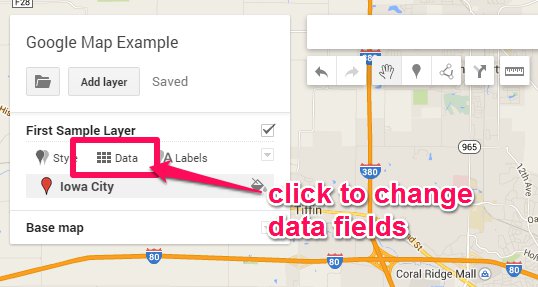 Step 7: Once you have clicked "data", a small insert will open that looks like a Google Sheet. You can then add/delete columns. You only need to do this once for this layer. Every time you add a new location for this layer, the data fields will apply to every location you add. 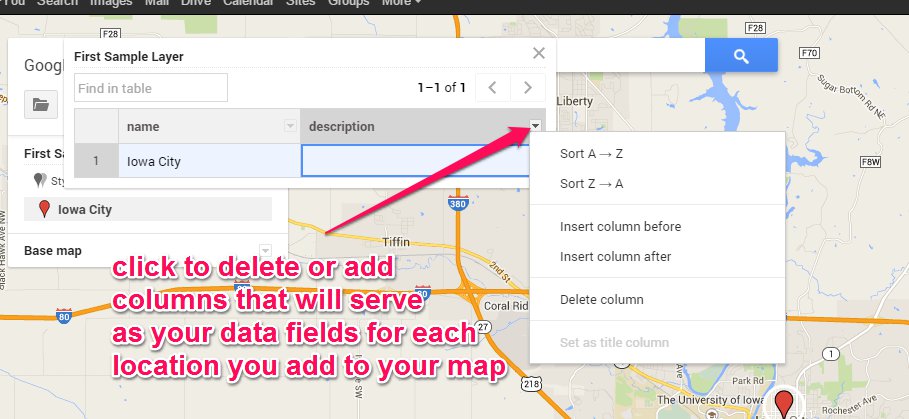 Step 8: After you have customized your "data" table, you can then add more locations to your chosen layer and customize the information for each location you add. 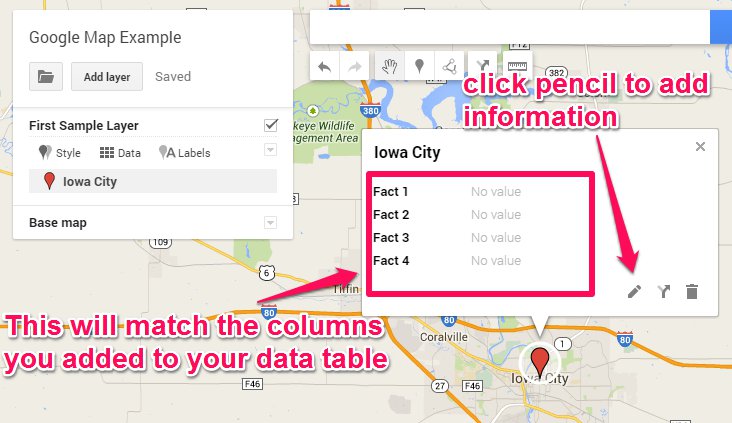 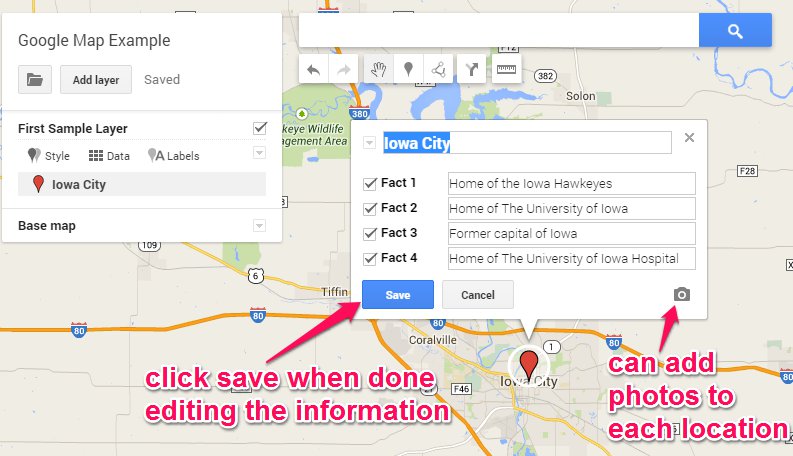 Step 9: You can continue to add more locations to your layer. You will be able to fill out information about each location you add. In addition, you can add more layers. However, when you add a new layer, your "data" table will need to be created again. Your data tables do not transfer from one layer to the next. Conclusion I was able to apply this Google Map making process to my social studies classroom. There are tons of other ways to integrate this across curricular areas. Check out Jim Sill's page on ways to integrate both Google Earth and Maps into your classroom. Share This: |
Andrew FenstermakerInstructional Technology Coordinator | Innovation Coach | Google Certified Innovator | Presenter | Blogger | Adjunct @UiowaEducation | Owner @kids_f_i_r_s_t 


|
 RSS Feed
