Our Final ProductOverview
I had the privilege of listening to Dean Shareski about the Classroom of the Future. When he talked about "literacy" in the 21st Century, he had us collaboratively complete a six word story about the state of Iowa. This activity was applicable to the classroom and led to a Six Word Story collaborative project between three schools, and seven teachers.
Set Up
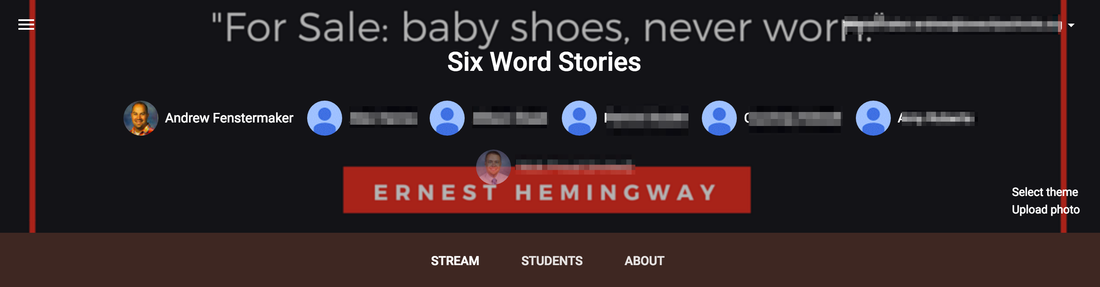
I began by setting up a Google Classroom that all the students could join. I also added each teacher as a co-teacher to this Classroom. You can see the project lesson plan for a quick snapshot of the layout.
Part 1: Six Word Story Introduction
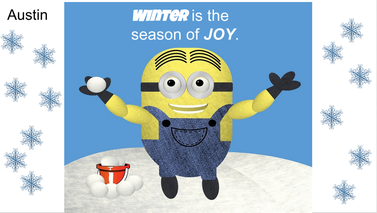
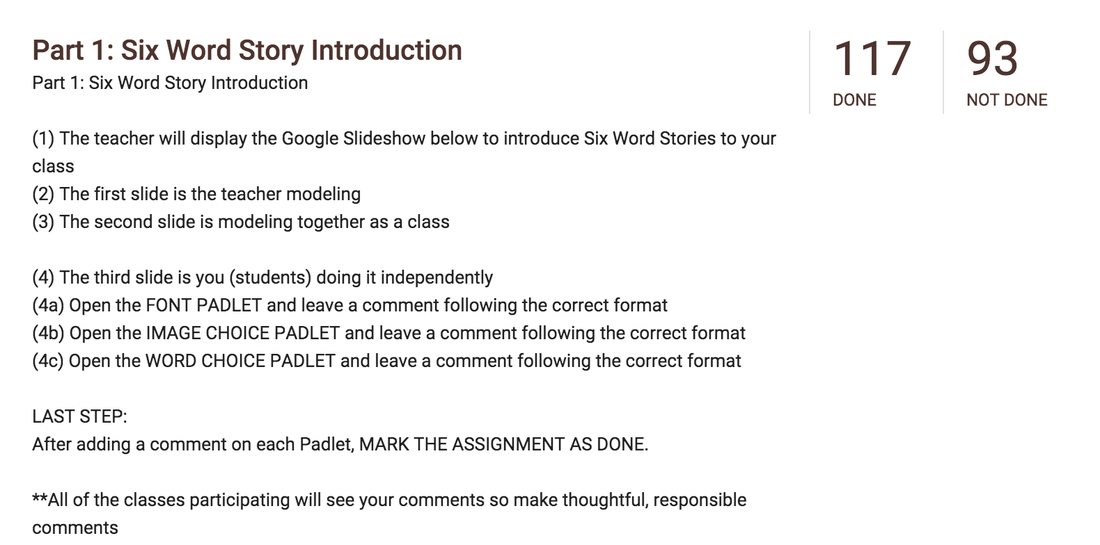
The first phase of this project was to introduce students to the concept of a six word story. We showed them a Google Slideshow. We completed an "I do," "We do," "You do," process when introducing the six word stories. The "You do" part utilized a Padlet for Font, Image Choice and Word Choice. This allowed all students to practice identifying how different elements of a story can impact the meaning for the reader. Furthermore, it allowed students to see everyone's ideas so it wasn't just their classmates. Below is a screenshot from Part 1 on Google Classroom.
Part 2: Practicing Word Choice, Font type, size and color
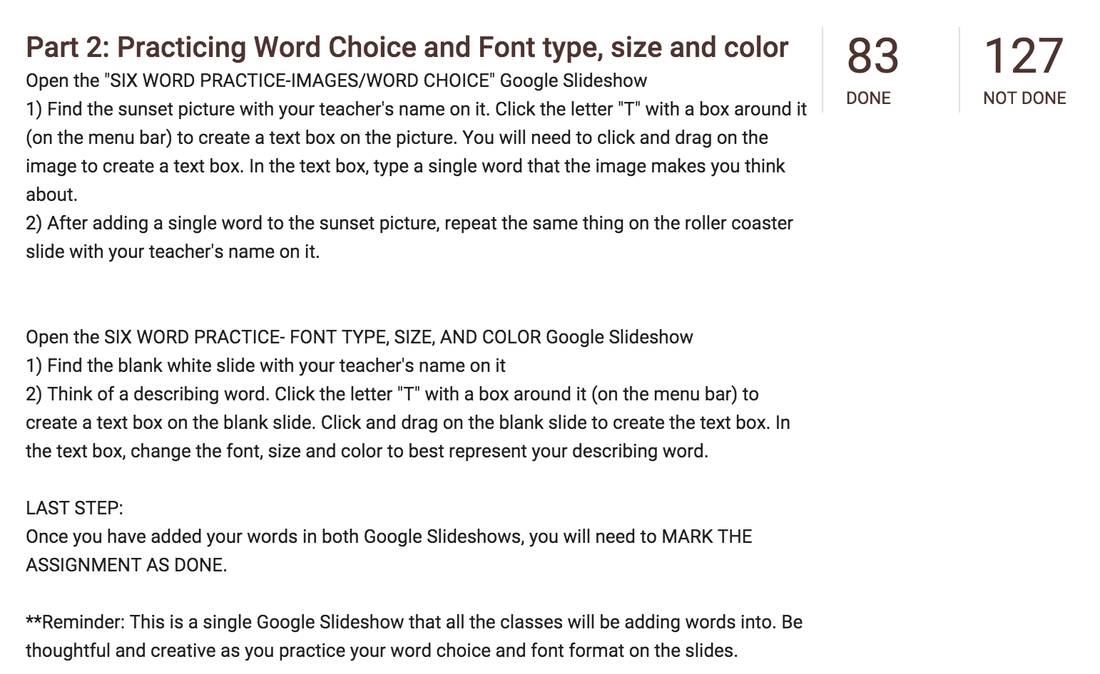
After students had started to develop an understanding of six word stories, we wanted to provide them with an opportunity to identify words that they felt connected with a chosen picture. In addition, we wanted them to practice changing the font type, color and size in a way they felt brought the story to life. To accomplish this, a single Google Slideshow for Word Choice was used for all students to practice. Moreover, a single Google Slideshow for Font allowed students to not only practice, but also view student examples from all who were participating in this collaborative project.
Part 3 and 4: Web your Words
The next step in this process was to get students to start brainstorming words. They had the choice to write about the season of winter or what they planned to do over winter break. We used a PDF web for them to start brainstorming words. This was beneficial for some students. However, many students were able to come up with their six words without needing to web a variety of words.
Part 5 and 6: Creating Stories and Leaving Comments
The last phase of this project was for students to create their own six word story. We used a single Google Slideshow that all students had editing privileges to construct their stories. They got to select the image they felt brought their story to life. Furthermore, they got to play with the font size, type, color and location to enrich the impact of their story.
After students had the chance to build their stories, their final task was to leave comments on other stories. The goal was to have students leaving feedback about the element of the story they felt had the most impact on a reader and why they felt that way. 
Conclusion
I feel very fortunate to work in a district with so many amazing teachers that are willing to take on a collaborative project the week prior to winter break. We had never done this project before, but we were willing to take a risk. Besides, how could students refuse to write only six words?
We were truly blown away by the amazing creations that students came up with. They had a blast being able to create and share with others around the district. I am looking forward to making this an annual project and hope to grow it in the future. Share
0 Comments
The Plan..... We had been studying how to turn data into pie charts or "percent circles." I had planned to have students take some data, add it into Google Sheets, create a pie chart, save their chart as an image, and create a Thinglink to add "tags" to the slices of the pie chart. The Data and Chart... Our community is home to The University of Iowa. With it being NCAA basketball season, we decided to use some statistics from theIowa men's basketball team. 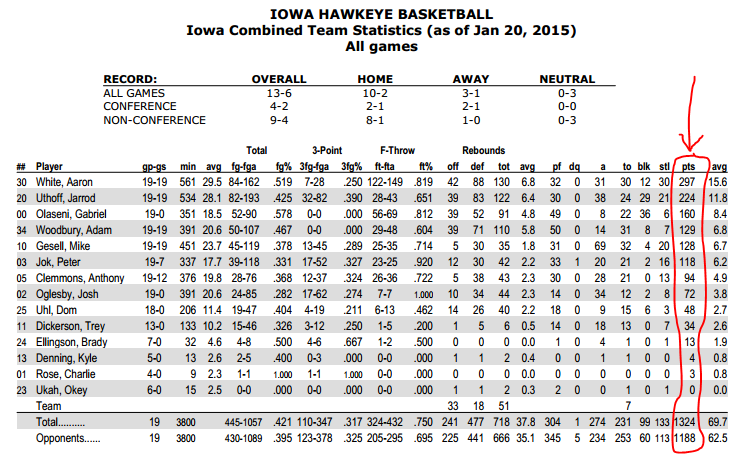 We started by looking at the total points scored by each player on the team. We took the data and put it into a Google Sheet. 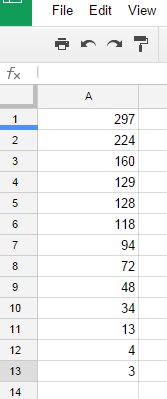 After the data was recorded in the Google Sheet, it was highlighted. After being highlighted, we clicked insert and chart. 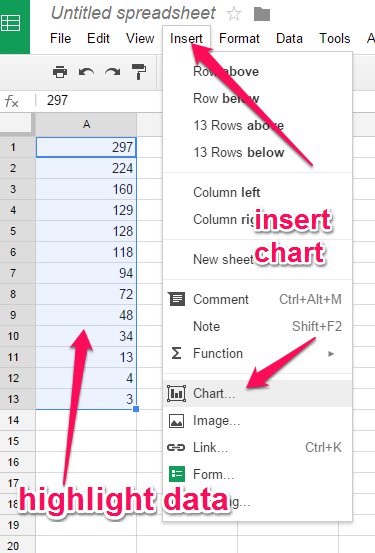 After selecting to insert chart, we selected "charts" and then we were able to choose "pie chart." 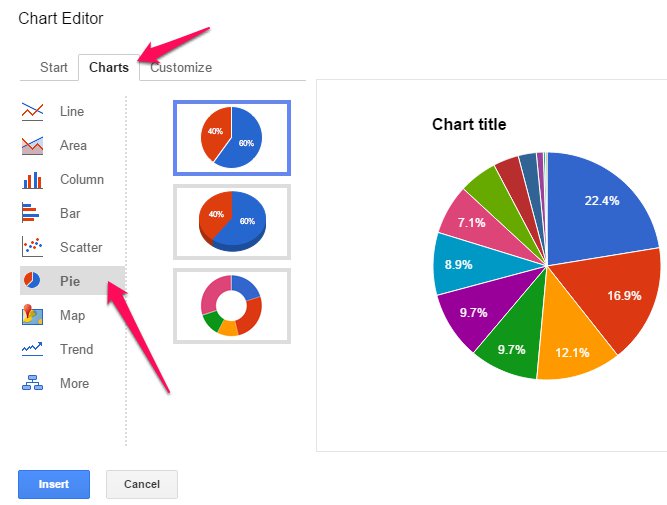 After the chart was chosen, we then clicked insert to get it into the Google Sheet. At this time, we took a screen shot of the pie chart. We saved the screen shot to our desktop for easy access. 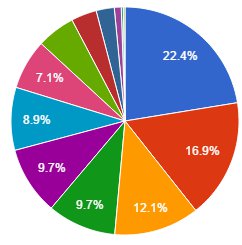 Thinglink... After our pie charts were saved to our desktops, we navigated to Thinglink. After signing into Thinglink, we clicked "create" to begin adding tags to our pie chart. 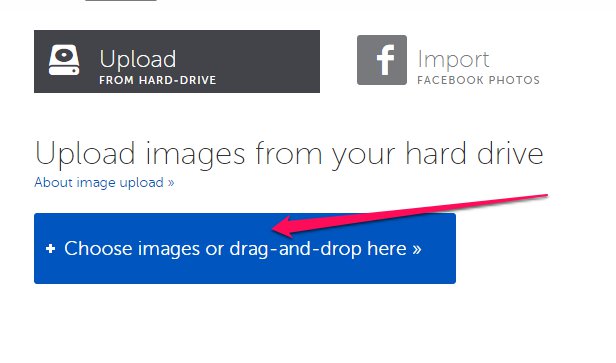 We chose to upload images. Students would select the image from their desktop. Once loaded in Thinglink, we gave our picture a title and added our first "tag." 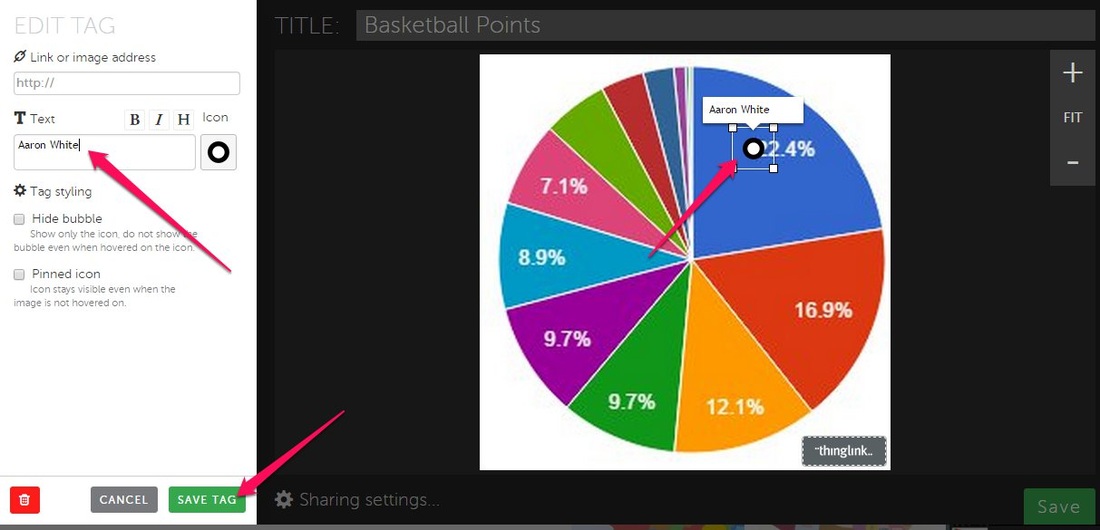 Students used the stats of the men's basketball team to correctly name the tags. Each tag was supposed to contain the name of the player who had scored that percent of the total points. This process was repeated for all slices in our pie chart. Upon completing their interactive image, they clicked share and copied the embed code. This embed code was then added to their Kidblog to share. The next step of this process was to look at more statistics from the men's basketball team. Take away... We could have done this same process using the provided data from the curriculum. However, to make this a more authentic experience, we chose to utilize some of the local information we had available. Students were able to make a connection with the data and knew almost all of the players. It was a fun way to practice pie charts in an authentic way. Share This: |
Andrew FenstermakerInstructional Technology Coordinator | Innovation Coach | Google Certified Innovator | Presenter | Blogger | Adjunct @UiowaEducation | Owner @kids_f_i_r_s_t 


|
 RSS Feed
