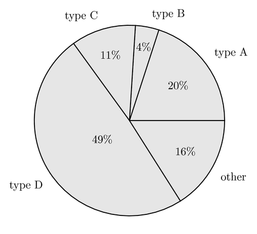
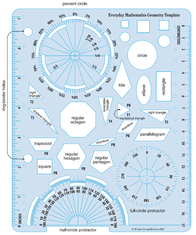
Once skill that is being practiced in fifth grade right now is creating pie charts. We have been talking about creating fractions, turning them into decimals, then into percents to create a pie chart using a template.  We used Poll Everywhere, SMART Notebook and our LearnPads to create an authentic experience for creating our own pie charts. Poll Everywhere To begin the activity, I create a total of five polls to have my class complete. I grouped them within the Poll Everywhere dashboard and labeled it as Pie Charts. 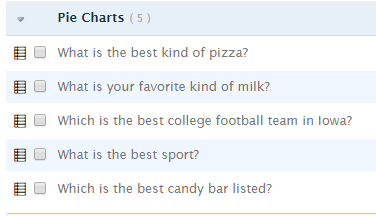 Students navigated to my custom URL to complete my polls. One of the five polls was displayed on the SMARTBoard while students completed the survey on their LearnPads. *Below is an image of what my students would see on their tablets. 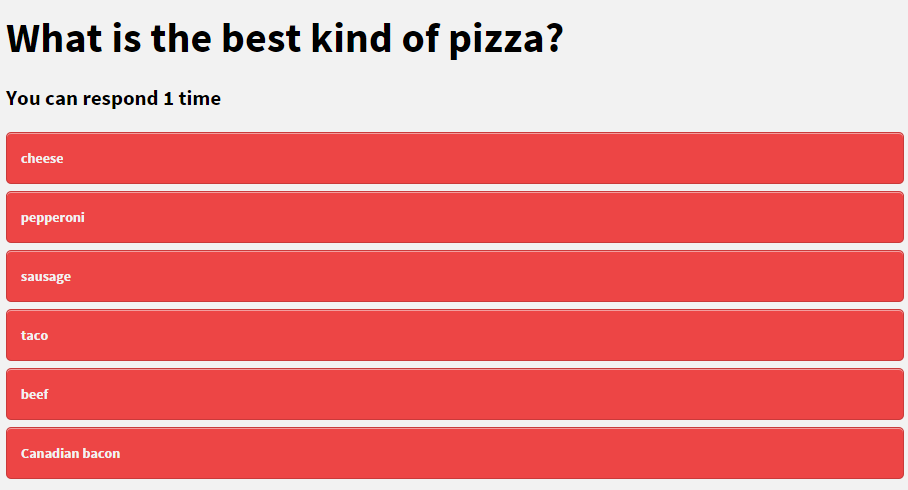 The students were able to see the results in real time as we took the poll. Once everyone in class had made a choice, I used the screen capture tool in my SMART Notebook software to snip the results and quickly put into a slide within SMART Notebook. 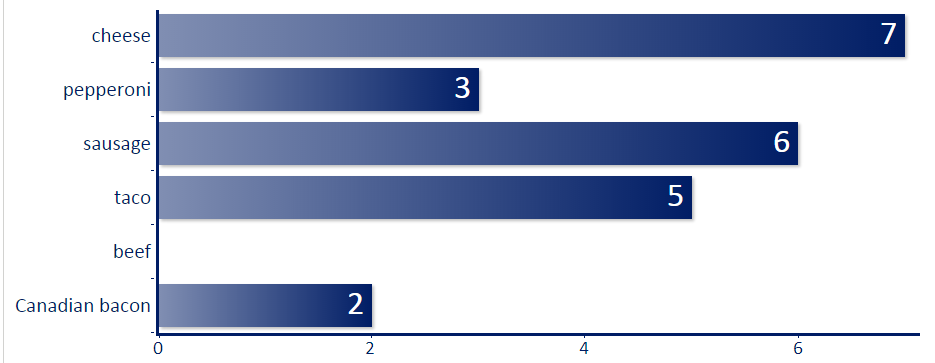 SMART Notebook After using the snipping tool within SMART Notebook, I change the poll for students to continue completing all five of the polls. After each poll, I used the snipping tool to capture each result and put into the SMART Notebook software. 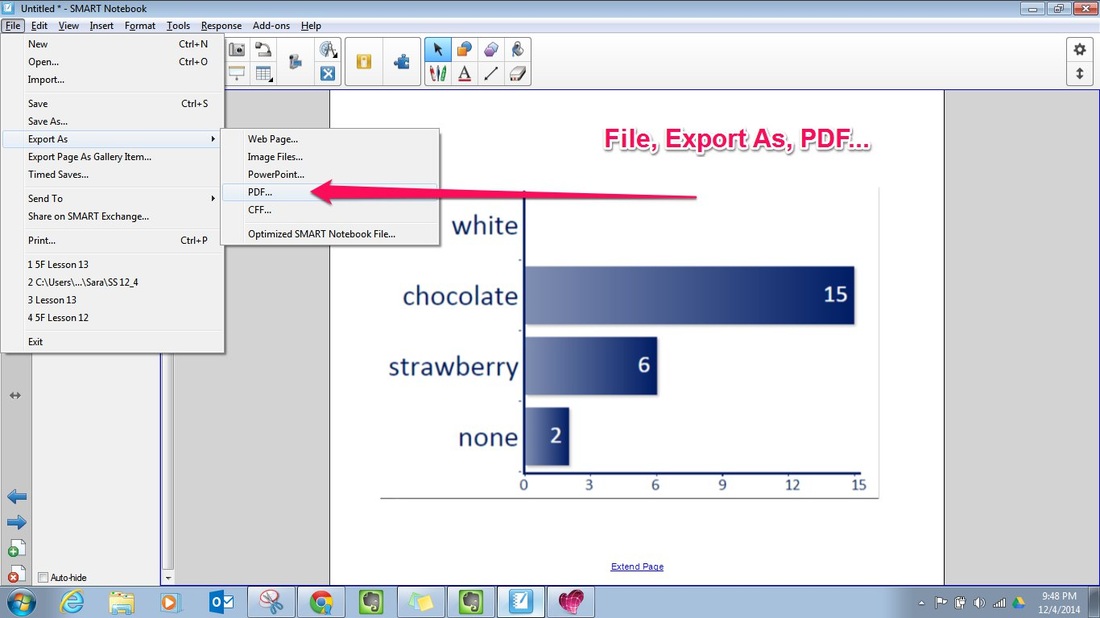 After all the polls were added into the SMART Notebook software, there is an option to export it as a PDF. This would be very similar to exporting a PowerPoint or Google Slideshow as a PDF. LearnPAD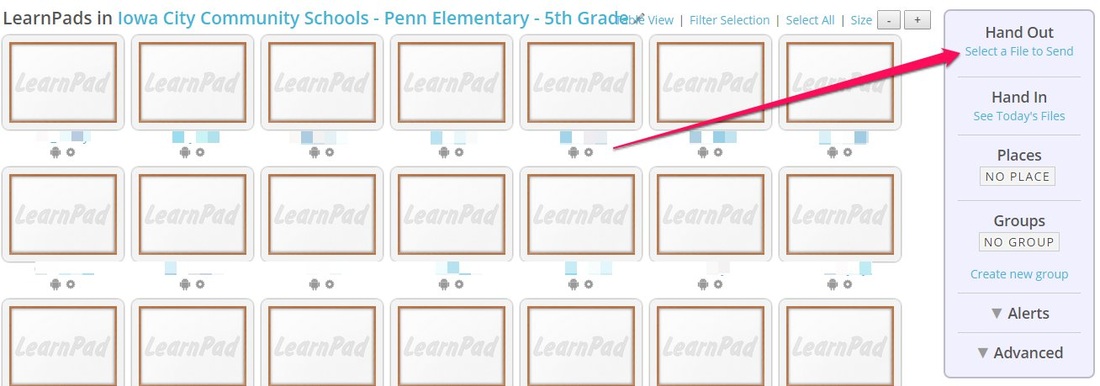 Once the file was exported to a PDF, I logged into my LearnPad Portal online. Within the dashboard, where I can see all my students' tablets, I have the option to "Hand out" a file. I selected the "Pie Chart" PDF file and it was automatically sent to all the students' LearnPads. This allowed all of them to access the PDF results on their LearnPads. Pie Charts To wrap up the assignment, students used the data gathered from the Poll Everywhere Polls to create their own pie charts. They used the template above to correctly divide their pie charts. They had to create fractions of the data, convert to decimals and then finally into percents. Once they had the percents, there were able to correctly divide their circles into the correct portions. The students really enjoyed the chance of creating their own data together using Poll Everywhere and then having the chance to turn it into pie charts. Share This:
0 Comments
Our target skill for this week was conclusions. We began by watching the YouTube video below.  After watching the video, we talked about drawing a conclusion. We were able to conclude that the cake was made for his mother. After our brief discussion, we wanted to practice our skill. I put together some QR Codes to assist with practicing conclusions. I had my students use their LearnPads to scan codes using the ScanLife app. In addition, I had created a quiz using Socrative. Students opened up both apps and were able to toggle back and forth. They scanned a code with the ScanLife app and then provided their answer within the Socrative app. The QR Codes provided three of four statements. These statements were clues that students could use to conclude what was taking place. For example, 1) Your mom takes your temperature, 2) You have to stay in bed all day, 3) You eat soup. Based on these clues, a student could conclude that you are sick. If you would like to use the QR Codes, you can access them here. There are a total of six "mystery conclusions" for students to solve. You can add the Socrative quiz by using the following: SOC #: 13411210 This activity got them out of their seats as well as provided some practice with drawing conclusions.
During our reading group rotations I had students apply their understanding of conclusions by creating their own mystery conclusions. To accomplish this, students used iClipart for Schools. They located three to six pictures that they could use as clues for an activity of their choice. Once they had their pictures, they opened up the Pic Collage app and created a collage of their three to six pictures. Their collage was saved to their Google Drive accounts. The final step was to create a new post using Kidblog. They titled their post Conclusions and inserted their collage from their Google Drive account. Tomorrow we will be spending time during reading rotations leaving comments on each post about conclusions. We will leave our "conclusion" guess in the comment box on each of our classmates. This process of creating their own conclusion collage required them to think critically about which pictures should be used to represent their activity. In addition, they had to apply their understanding of conclusions in order to leave a comment on each others' blog post. Below are some example collages that my students created during this process. 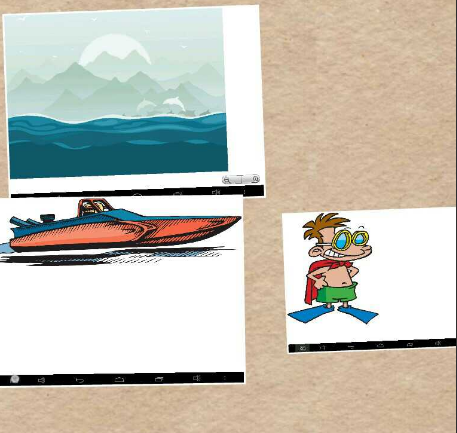 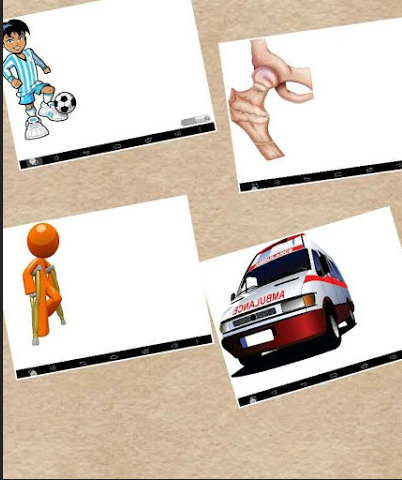 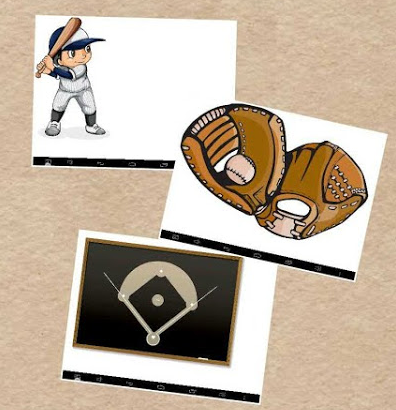 Share This: |
Andrew FenstermakerInstructional Technology Coordinator | Innovation Coach | Google Certified Innovator | Presenter | Blogger | Adjunct @UiowaEducation | Owner @kids_f_i_r_s_t 


|


 RSS Feed
